Suspicious activity in the Litecoin network may increase pressure on LTC
- Cybercriminals may be plaguing Litecoin network.
- LTC/USD may retest critical support of $40.00.

Litecoin developer Franklyn Richards noted suspicious activity in the Litecoin network. He believes it may have something to do with the August "dust attack."
According to Richards, the Litecoin network has about 40,000 active addresses per day on average. However, BitinfoCharts statistics show that once in a week, this number reaches 70,000 and then retreats again to the normal levels.
The suspicious activity was first registered on August 20. Meanwhile, on August 10, the network fell victim to a massive dust attack. Someone sent tiny amounts - usually worth factions of fractions of a penny - to various addresses to trace further movements of these coins and thus identify the owners of the addresses. It is worth mentioning that the amounts are so small that users cannot spend them separately. They will have to include it into another transaction that will further be traced by the attacker.
He comments:
"It seems the attacker has chosen to scale back their operations and push out less dust more often based on other active users during each weekly period. This would allow for the creation of a set of more detailed and useable insights when attempting to track and map the interactions between participants."
However, it would be difficult to understand the real motives behind these actions without access to enhanced data tools for the Litecoin network.
LTC/USD: technical picture
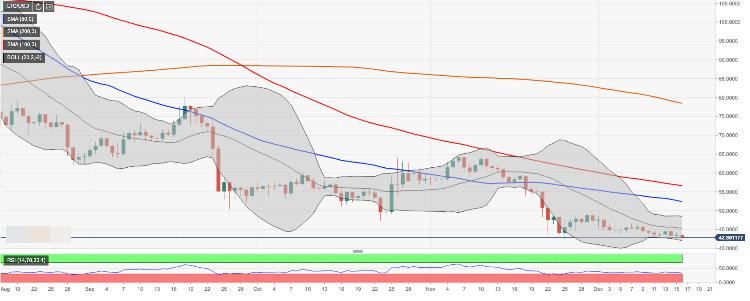
Meanwhile, LTC/USD is changing hands at $42.80, down 1.5% since the beginning of the day and 1% on a day-to-day basis.
On the daily chart, the initial resistance is created by the lower line of the daily Bollinger Band at $42.00. Once it is broken, the sell-off may continue towards a psychological $40.00. This support is likely to trigger an upside correction. Otherwise, the bearish trend will start snowballing towards $30.00.
On the upside, the initial resistance comes at $43.00, followed by $48.50 ( the upper line of the daily Bollinger Band). Once it is out of the way, the upside is likely to gain traction with the next focus on $50.00 and SMA50 (Simple Moving Average) daily at $53.50.
LTC/USD, the daily chart
Author

Tanya Abrosimova
Independent Analyst


