|

Stellar Price Forecast: XLM’s rebound could slow down in the short-term

  • Stellar price is currently around $0.188 as the digital asset attempts to rebound from a low of $0.145.
  • One crucial indicator has turned bearish for XLM, showing a potential pullback in the short-term.

Stellar price was as high as $0.231 on November 25 before the crypto market collapse. The digital asset lost around 37% of its value in 48 hours, but it’s attempting to bounce back up, currently trading at $0.188.

Stellar price could be facing a short pullback

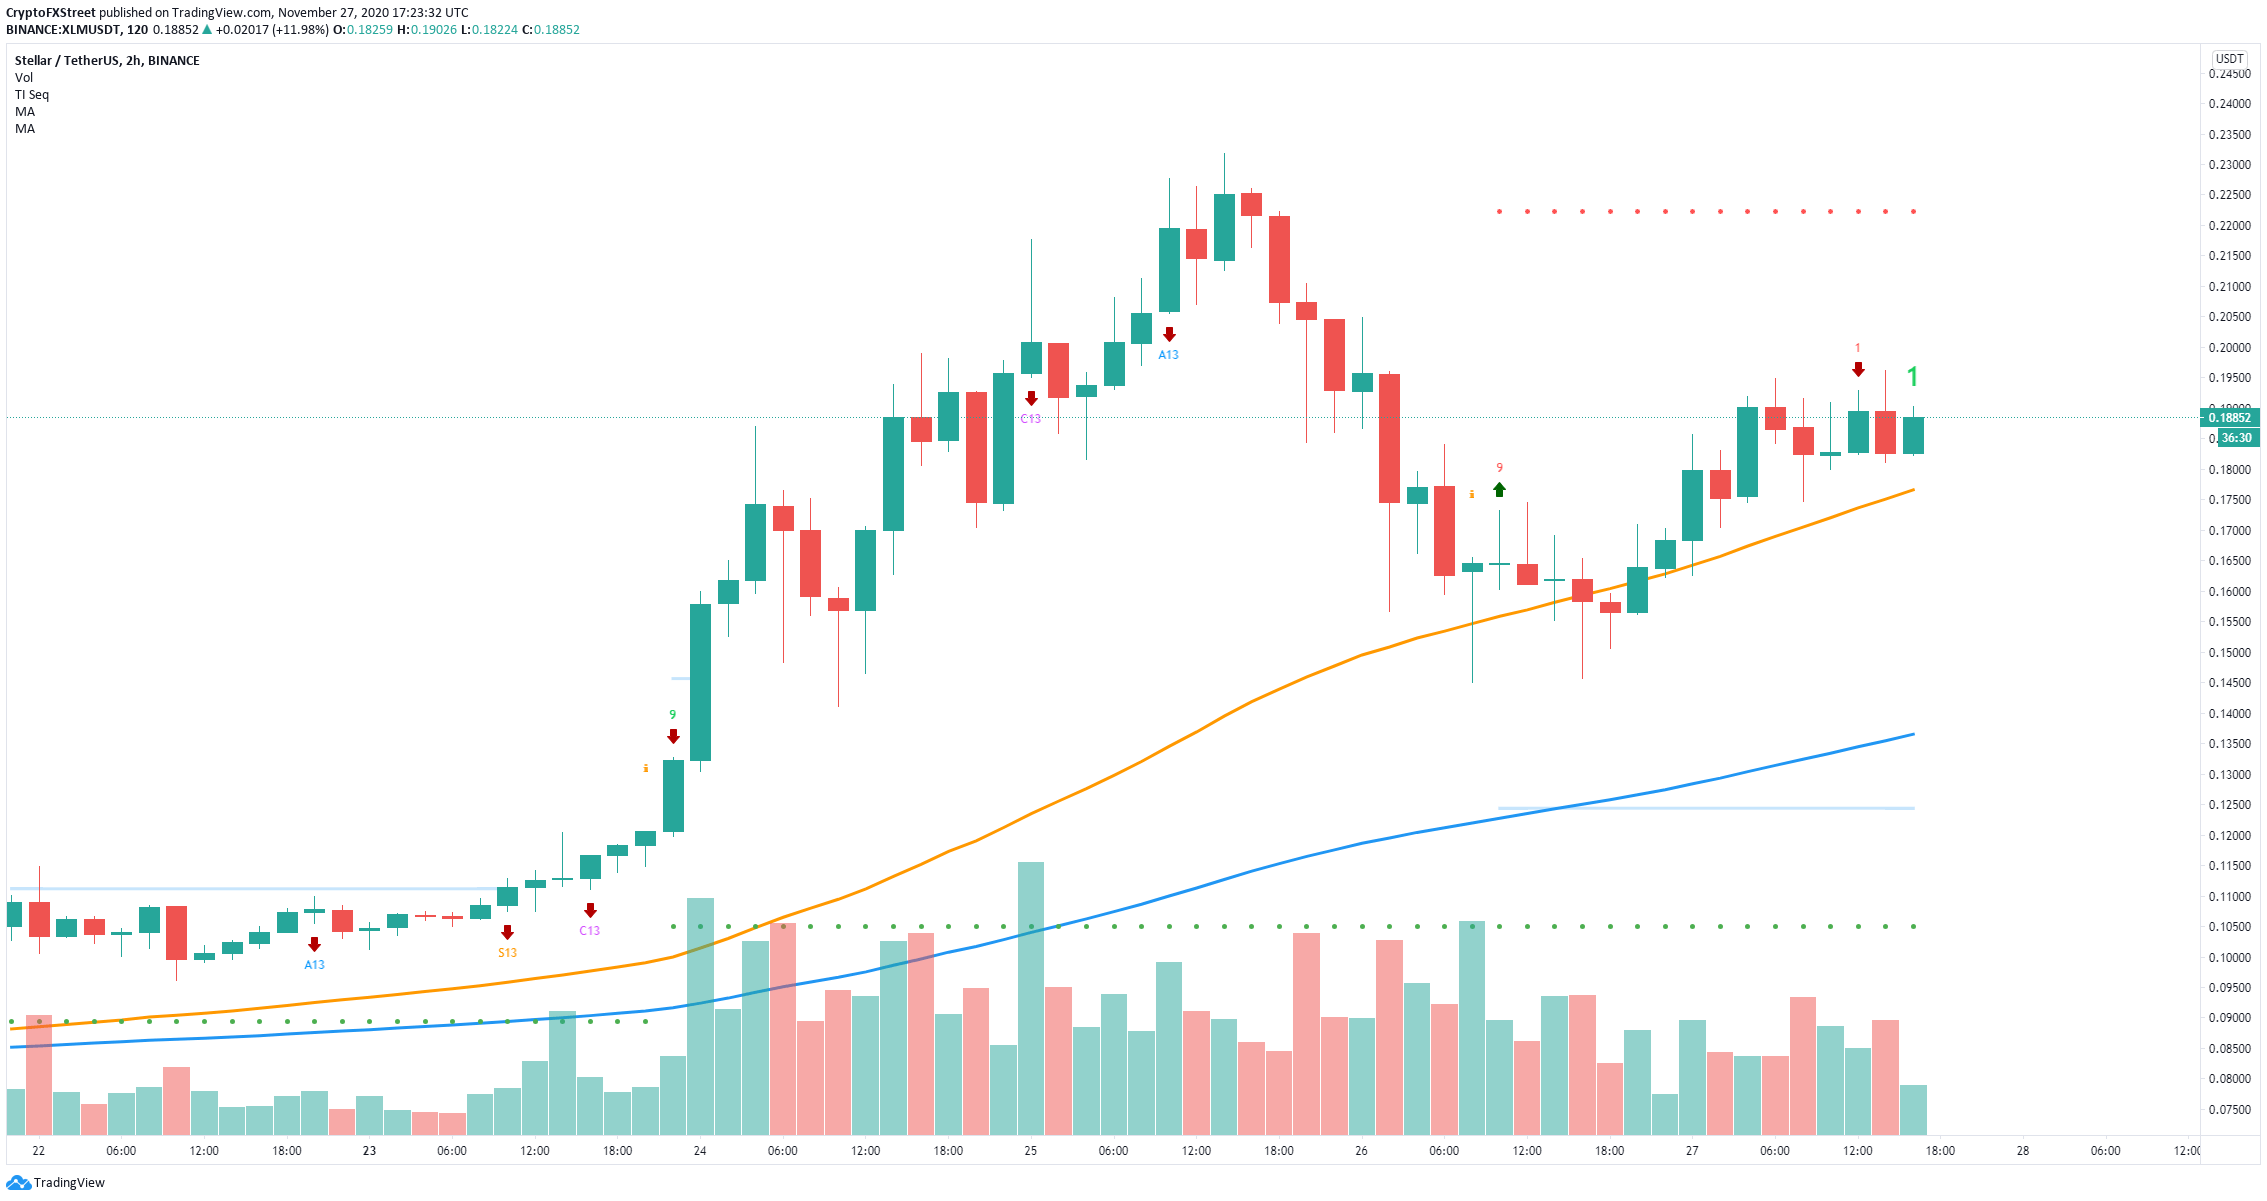
Since its temporary bottom at $0.145, Stellar price is up by 29% and continues hitting higher highs. However, on the 2-hour chart, the TD Sequential indicator has presented a sell signal hours ago.
xlm price

XLM/USD 2-hour chart

XLM could be aiming for a price target of $0.176, where the 50-SMA is standing on the 2-hour chart, only if the sell signal is validated. Losing this moving average can quickly drive Stellar price towards the 100-SMA at $0.136.

However, so far, the bulls have done a great job of defending the 50-SMA and could continue pushing Stellar to new highs. The last high at $0.196, which is close to the psychological level of $0.2, is the strongest resistance level.

Climbing above the area between $0.196 and $0.2 can push Stellar price towards the 2020-high at $0.231. A breakout above the top would lead XLM to a new high at $0.25 and potentially even $0.30 in the longer-term.

Author

Lorenzo Stroe

Lorenzo Stroe

Independent Analyst

Lorenzo is an experienced Technical Analyst and Content Writer who has been working in the cryptocurrency industry since 2012. He also has a passion for trading.


More from Lorenzo Stroe
Share:

Editor's Picks

Ripple and Stellar outlook: XRP rally cools, XLM heads toward a make-or-break support

Ripple and Stellar trade under pressure after losing over 2% and 3% so far this week. XRP and XLM are both nearing their crucial support zones, which could determine the next directional move. Meanwhile, mixed derivatives and on-chain data suggest upside potential remains limited for both altcoins. CryptoQuant’s summary data shows cautious signs for both altcoins.

Crypto Overview: Bitcoin dips below $78,000 – NEAR, ZEC sustain gains

Bitcoin trades below $78,000 maintaining a near-term corrective tone amid hawkish macroeconomic factors. US bond market shrugs off the US Treasury's increase in buyback operations to $6 billion in long-term debt as yields continue to rise, signaling an insufficient step amid the ongoing war with Iran.

Bitcoin outperforms global assets as $83K-$86K resistance zone continues to weigh on rally

Bitcoin has continued to recover from its mid-year weakness, outperforming major traditional assets over the past month, amid strong resistance around the $83,000 to $86,000 range. BTC gained 23% over the past 21 trading sessions, while the S&P 500 and Nasdaq 100 were broadly flat and the Euro Stoxx 50 declined, according to a Glassnode report published Wednesday.

Ethereum Price Forecast: ETH holds near $2,500 amid derivatives weakness
Ethereum (ETH) holds steady near $2,500 on Wednesday amid weakness in derivatives and mild buying dominance in spot markets. Since the short squeeze that expanded ETH's rally toward $2,500 in late August, meaningful leverage has yet to return to support the uptrend.
Bitcoin: Gearing up for a sharp move
Bitcoin (BTC) is trading around $81,000 on Friday, up over 4% so far this week, and awaits a key catalyst that could determine its next directional move. Strong institutional demand is supporting the bullish price action, with spot BTC Exchange Traded Funds (ETFs) on track to record a third straight week of inflows.


