Ripple, Stellar, and Verge amongst the biggest losers in the recent bloodbath
- The entire cryptocurrency market wiped more than $80 billion in market capitalization in the past 24 hours.
- XRP, Stellar, and Verge are some of the most affected altcoins.

The total market capitalization peaked at $580 billion on November 25 before the massive crash in the past 24 hours. XRP is down by 26%, Stellar around 25%, and Verge at 32%. Is the bottom in for these coins or will they continue trending downwards?
XRP suffers a steep 42% correction
XRP was one of the few cryptocurrencies that remained flat almost for the entire month of November while the market was trending higher. However, on November 21, XRP price saw a massive 43% explosion followed by even more continuation on November 23. The price increased by 137% in just four days.
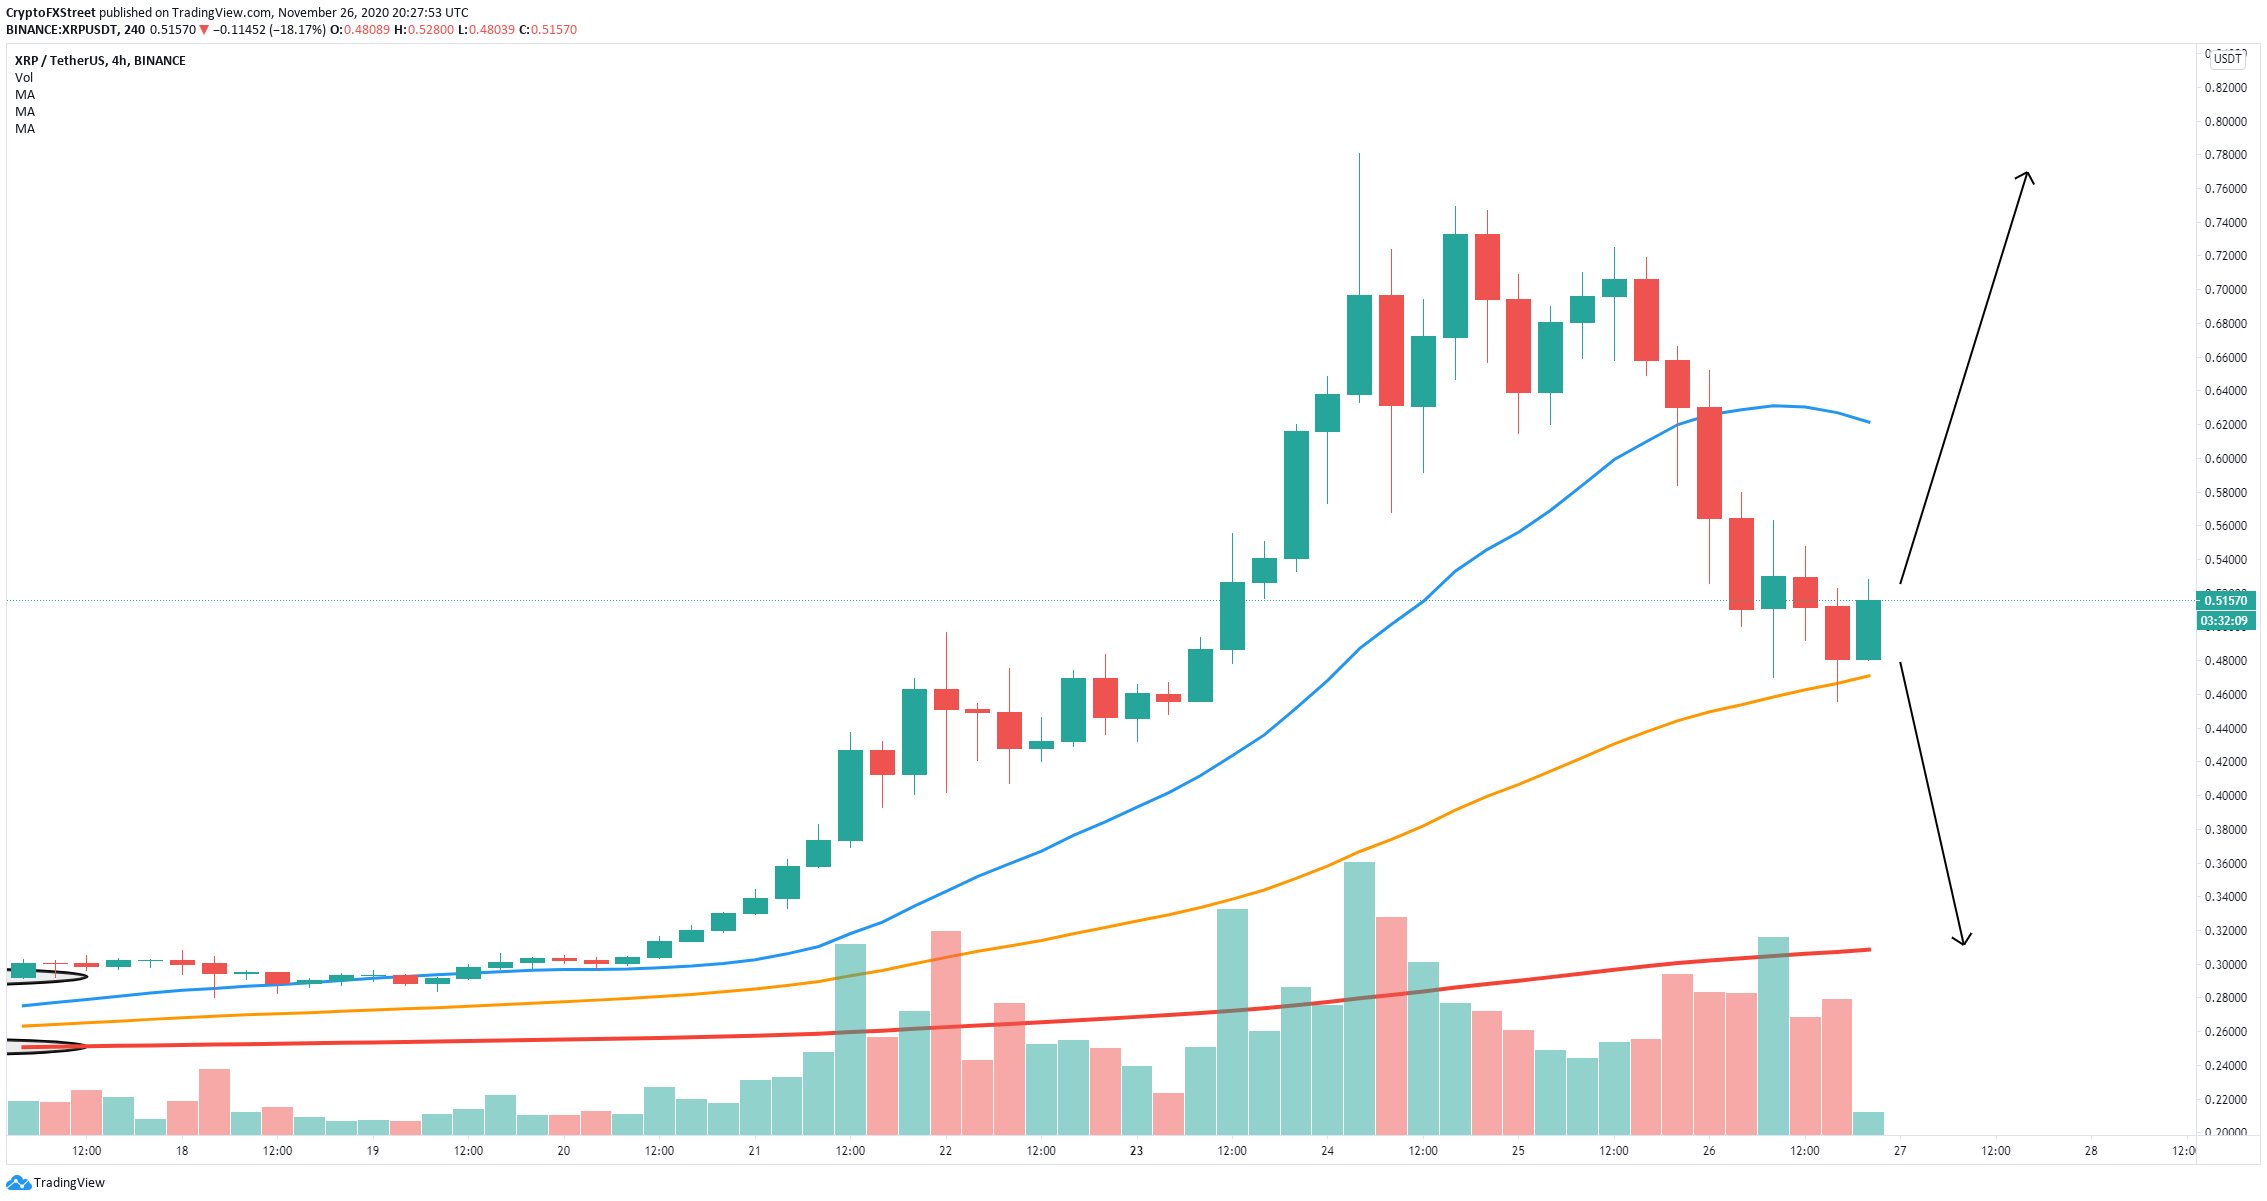
XRP/USD 4-hour chart
On the 4-hour chart, XRP bears have established a downtrend and broken above the 100-SMA at $0.625. The 50-SMA at $0.471 it’s the last support level. A breakdown from this point could quickly drive XRP price towards the psychological level at $0.40 and perhaps $0.30 where the 200-SMA is located.
On the other hand, a defense of the 50-SMA into a rebound could push XRP price towards the 100-SMA again. An additional breakout above $0.62 would drive the digital asset to its 2020-high.
Stellar bulls try to buy the dip
XLM suffered a similar 37% crash towards a low of $0.145 losing the 100-SMA but holding the other two SMAs. It seems that bulls are buying the dips establishing $0.145 as a strong support level and forming two bullish candlesticks on the 4-hour chart.
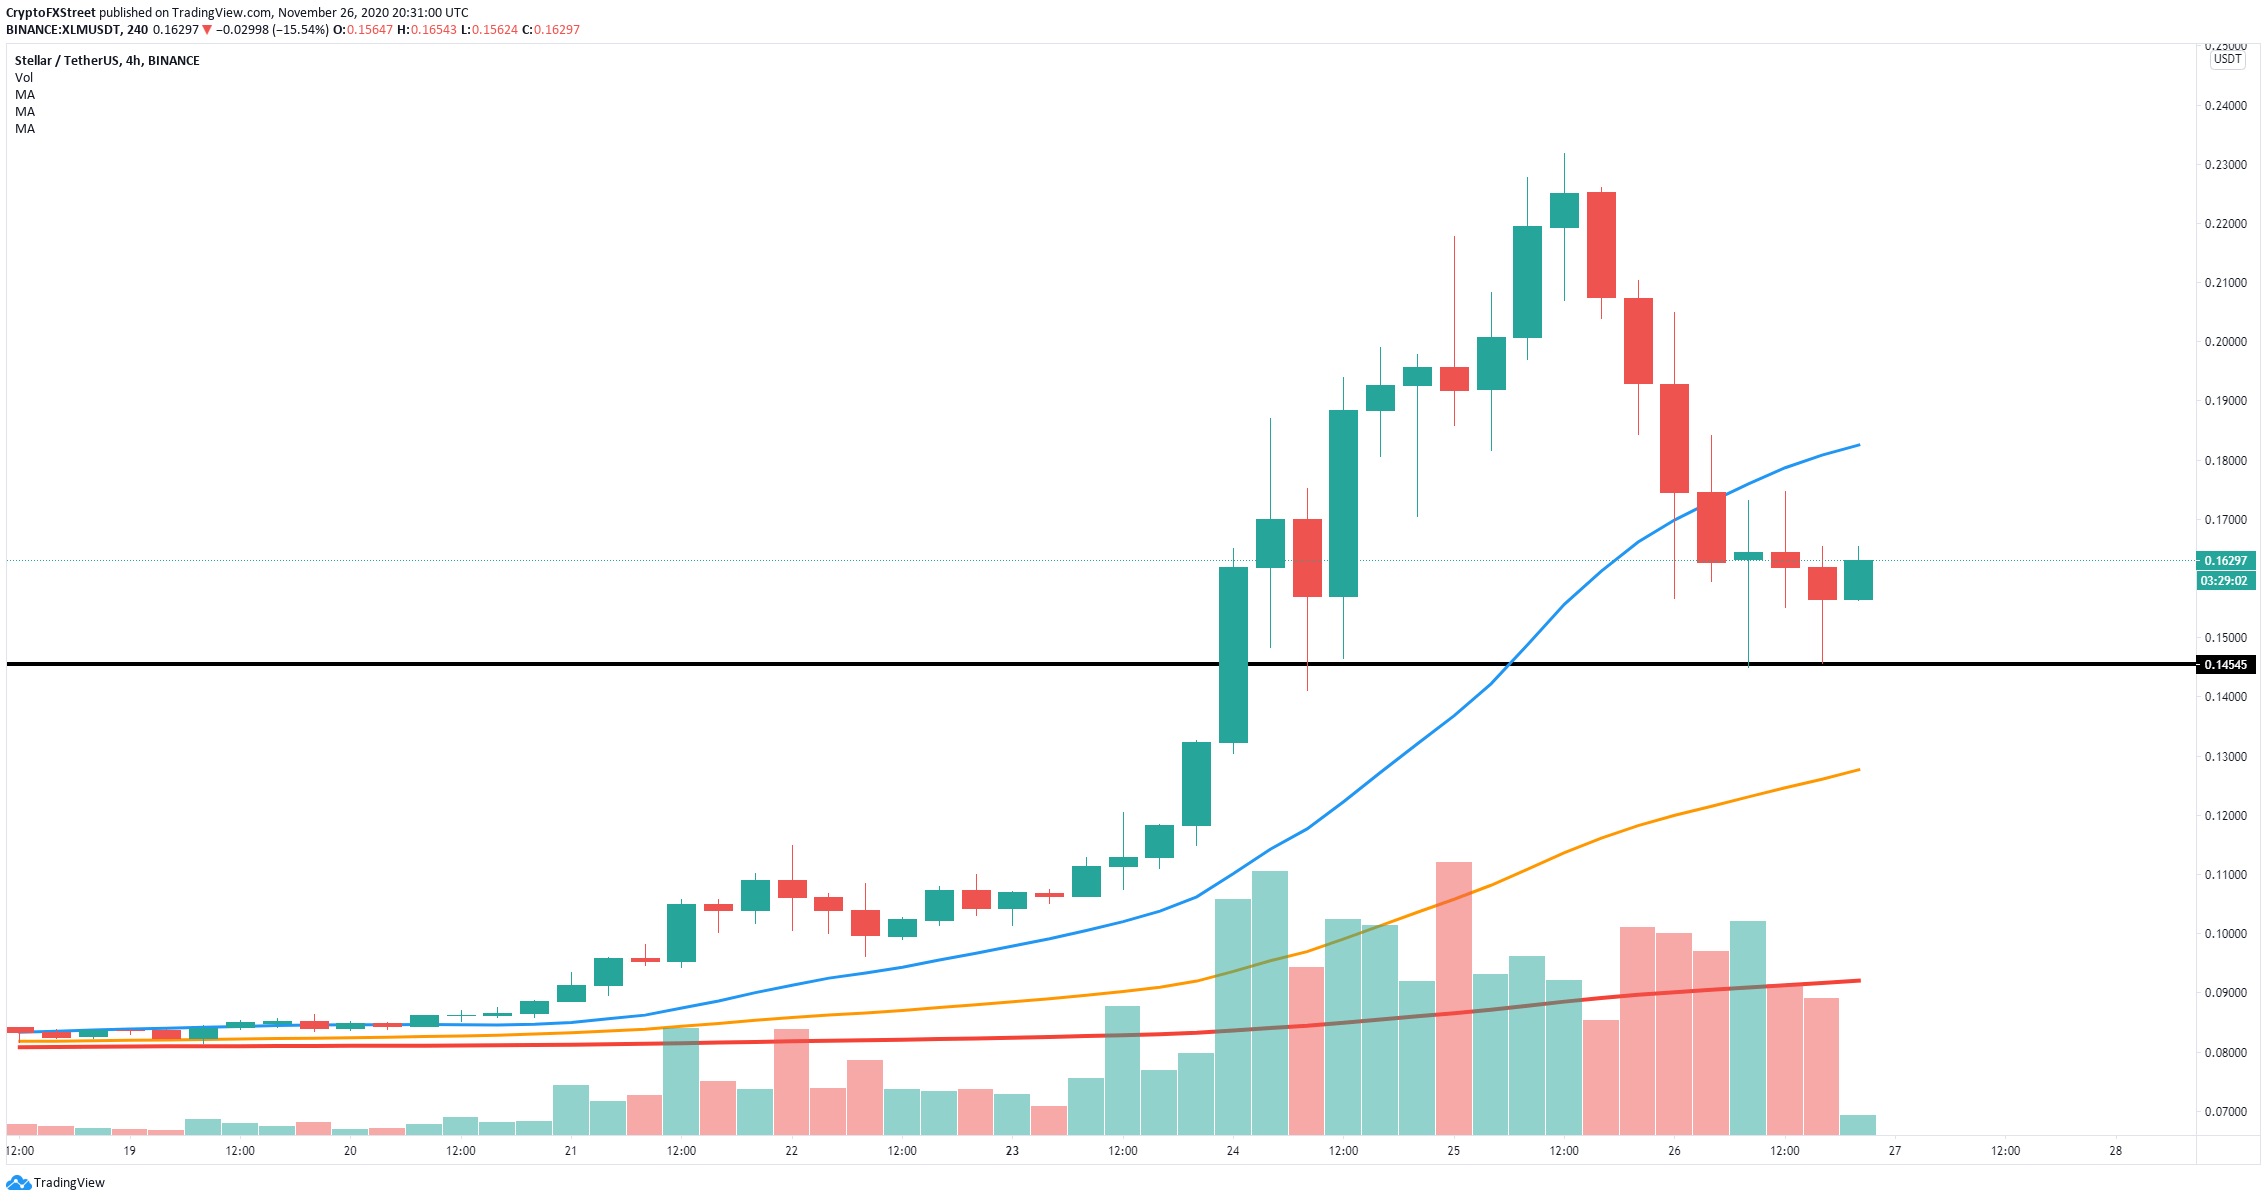
XLM/USD 4-hour chart
If Stellar price can climb towards the 100-SMA at $0.183 and see a breakout above it, it could quickly jump towards the 2020-high at $0.2317 as there is almost no resistance on the way up due to the magnitude of the crash.
On the other hand, failure to defend the critical support level at $0.145 would lead Stellar price to dive towards the 50-SMA at $0.127 and perhaps the 200-SMA all the way down at $0.092.
Verge flashes buy signal despite market weakness
Although Verge has lost 50% of its value in the past 48 hours, the TD Sequential indicator has just posted a buy signal on the 4-hour chart right after the bulls managed to defend the 50-SMA support level at $0.0056.
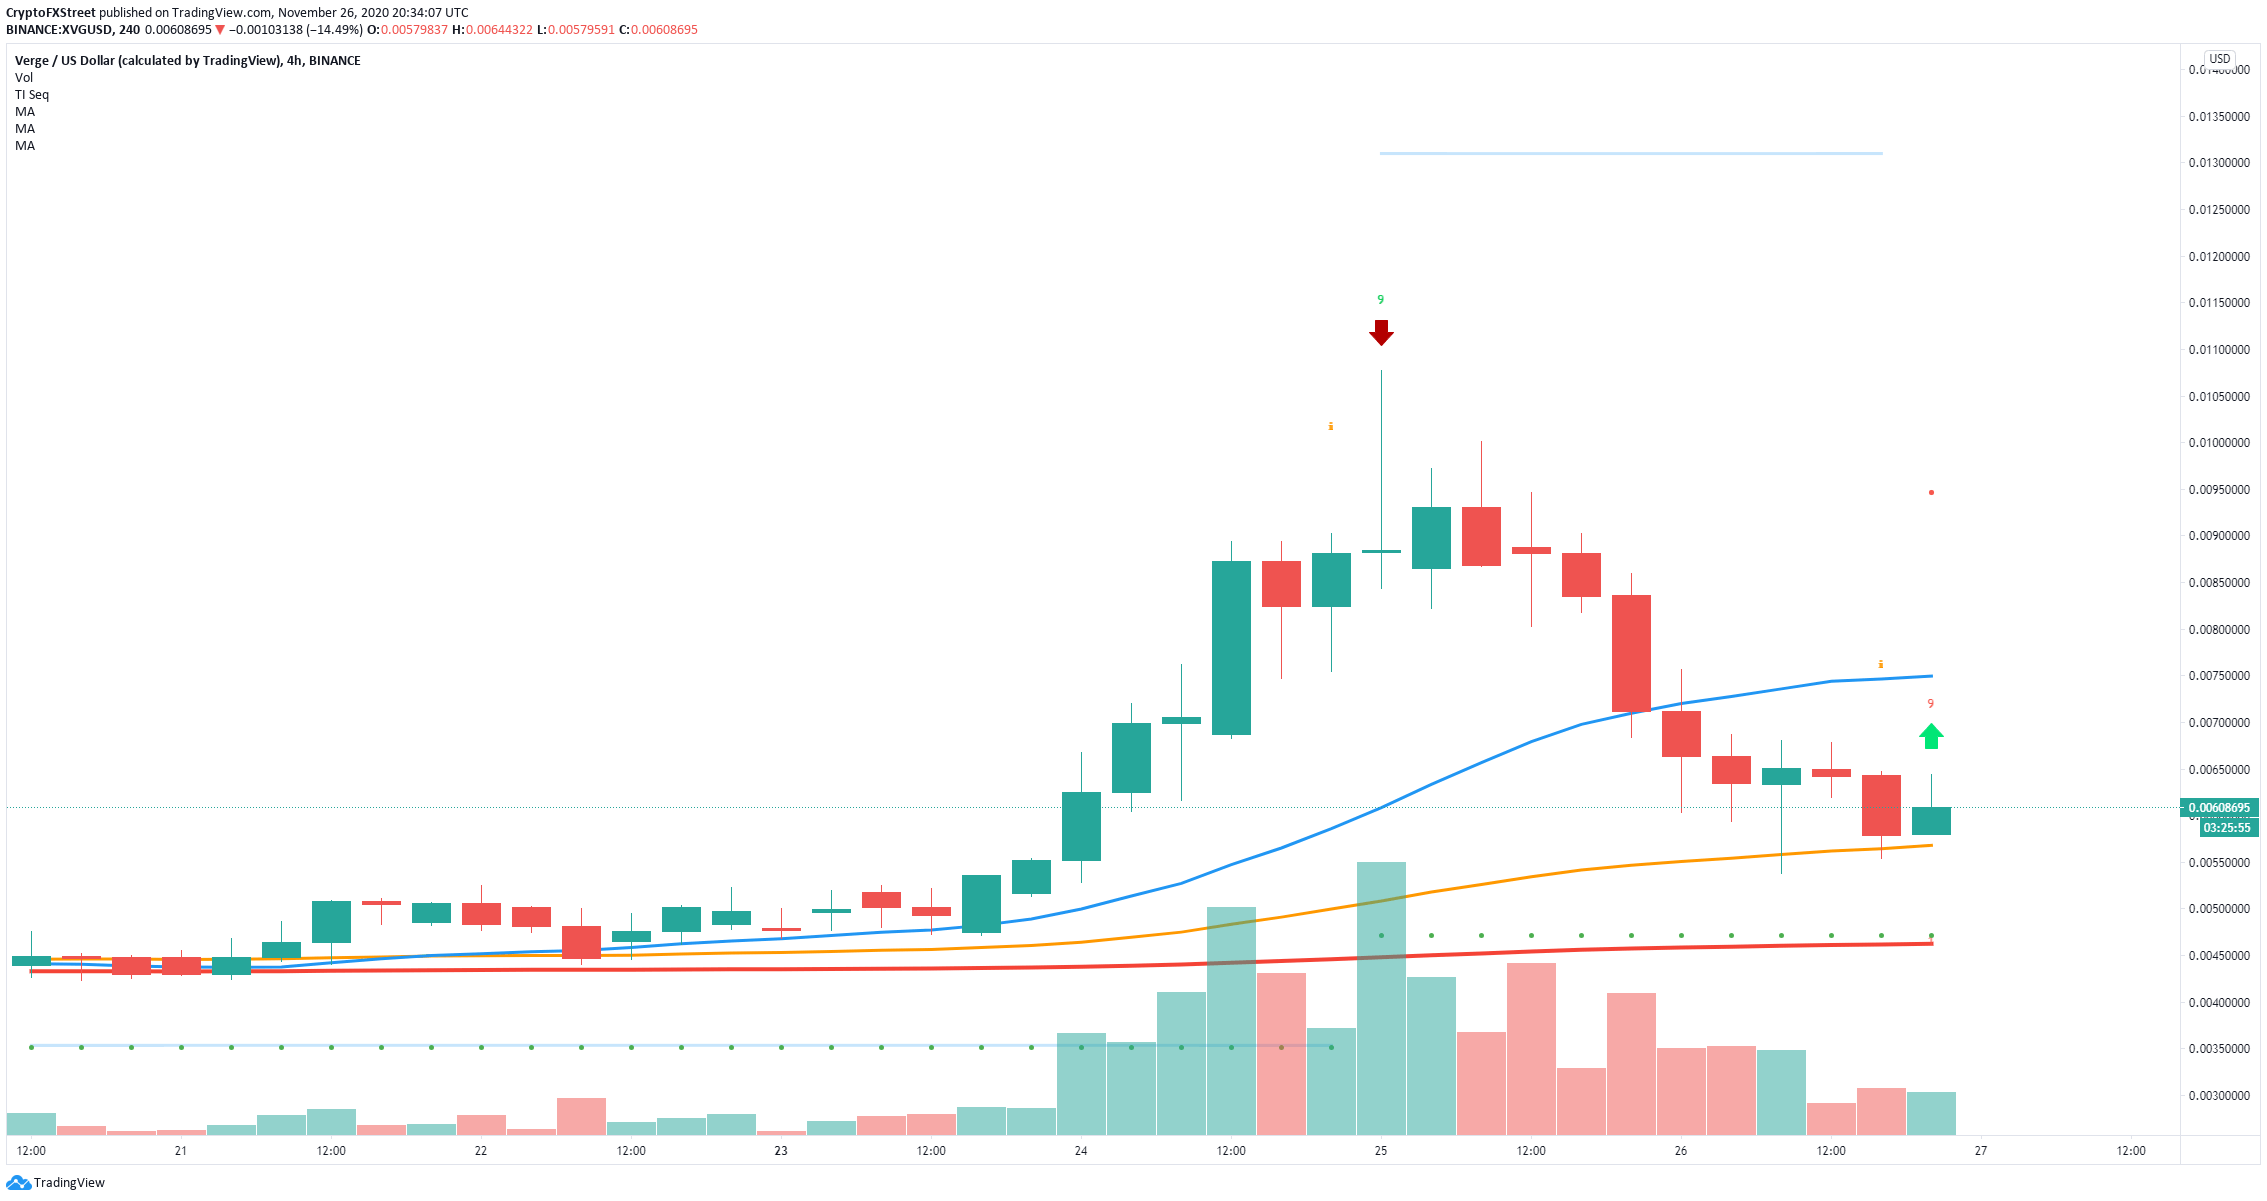
XVG/USD 4-hour chart
Bears need to crack the $0.0056 support level to push Verge price towards the 200-SMA at $0.0046. The breakdown below the 50-SMA would most likely invalidate the buy signal
Author

Lorenzo Stroe
Independent Analyst
Lorenzo is an experienced Technical Analyst and Content Writer who has been working in the cryptocurrency industry since 2012. He also has a passion for trading.


