Stellar Price Forecast: Eyes for further gains as bounces off support level and bullish on-chain metrics
- Stellar’s price experienced a pullback in the first half of the week but recovered in the second half, currently trading around $0.54 on Friday.
- On-chain data shows XLM’s TVL and Open interest are rising, suggesting a bullish outlook.
- A weekly candlestick close below $0.43 would invalidate the bullish thesis.

Stellar (XLM) experienced a pullback in the first half of the week but recovered in the second half and is trading around $0.54 on Friday, after rallying more than 170% and reaching levels not seen in over three years in the previous week. This bullish outlook is further supported by rising Open Interest (OI) and Total Value Locked (TVL) to record levels, indicating a further rally.
Stellar bulls look strong
Stellar price surged more than 170% last week and reached levels not seen since May 24, 2021. However, XLM faced a pullback in the first half of this week until Tuesday and recovered after finding support at its 50% price retracement level at $0.43. On Friday, it trades higher by more than 8% around $0.54.
If XLM continues its upward momentum, it could extend the rally to retest its May 2021 weekly high of $0.79.
However, the Relative Strength Index (RSI) momentum indicator on the weekly chart stands at 92, signaling overbought conditions and suggesting an increasing risk of a correction. An RSI’s move out of overbought territory could signify a pullback.
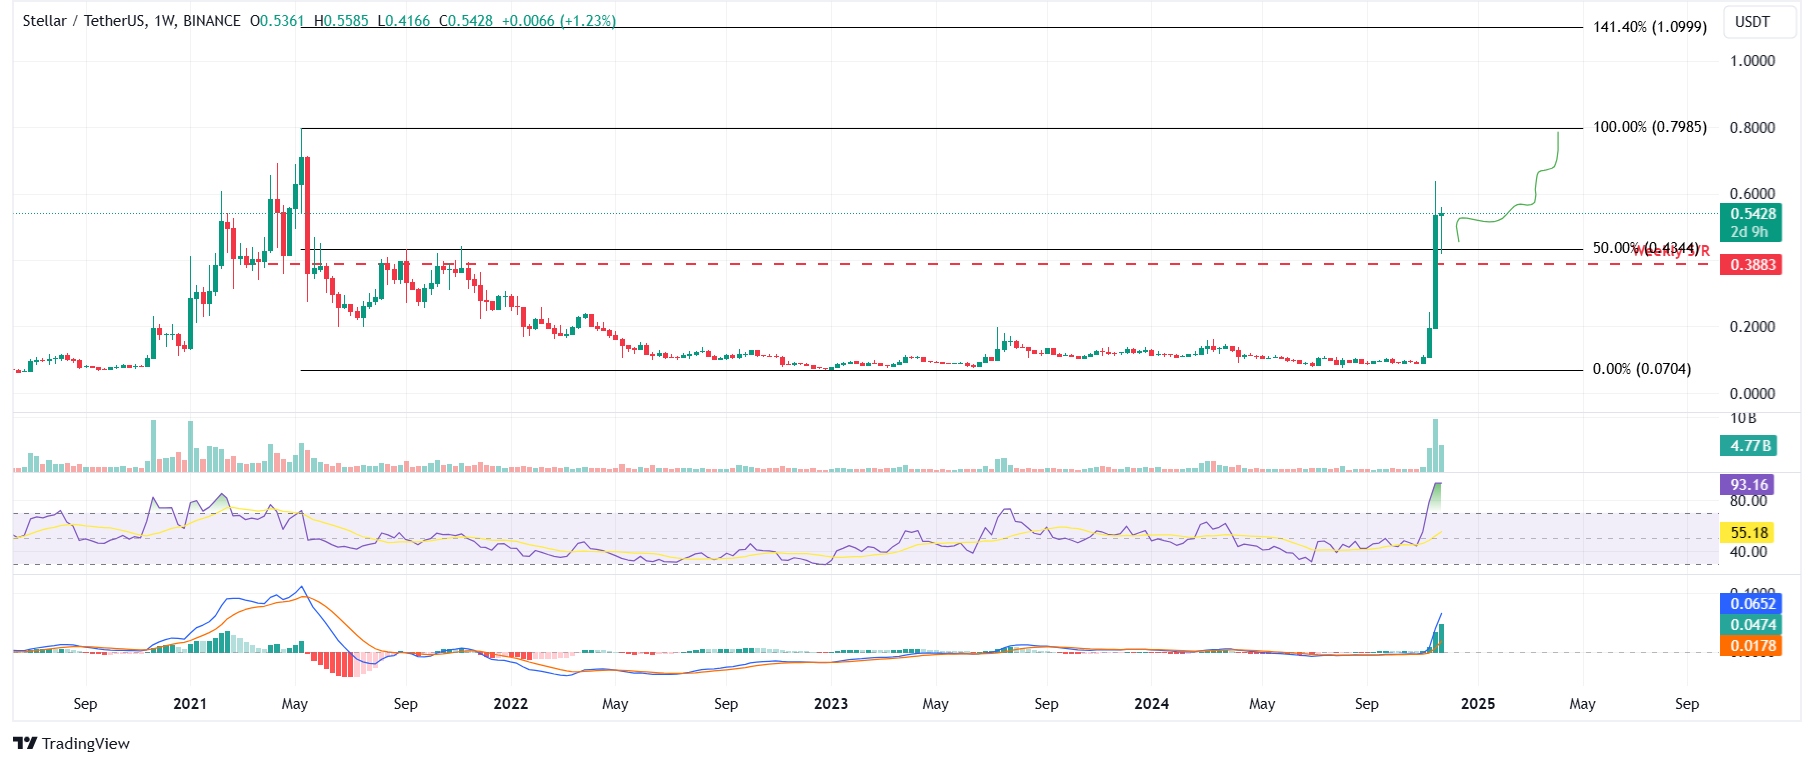
XLM/USDT weekly chart
Crypto intelligence tracker Artemis terminal data shows that Stellar’s TVL increased from $22.2 million on November 15 to an all-time high of $56.4 million on Friday, constantly rising since mid-November.
This increase in TVL indicates growing activity and interest within the Stellar ecosystem. It suggests that more users deposit or utilize assets within XLM-based protocols, adding credence to the bullish outlook.
-638684910342085300.jpg)
Stellar TVL chart. Source: Artemis
Stellar’s Open Interest (OI) also supports the bullish outlook. Coinglass’s data shows that the futures’ OI in XLM at exchanges rose from $264.40 million on Wednesday to $334.39 million on Friday. An increasing OI represents new or additional money entering the market and new buying, which suggests a rally ahead in the Algorand price.
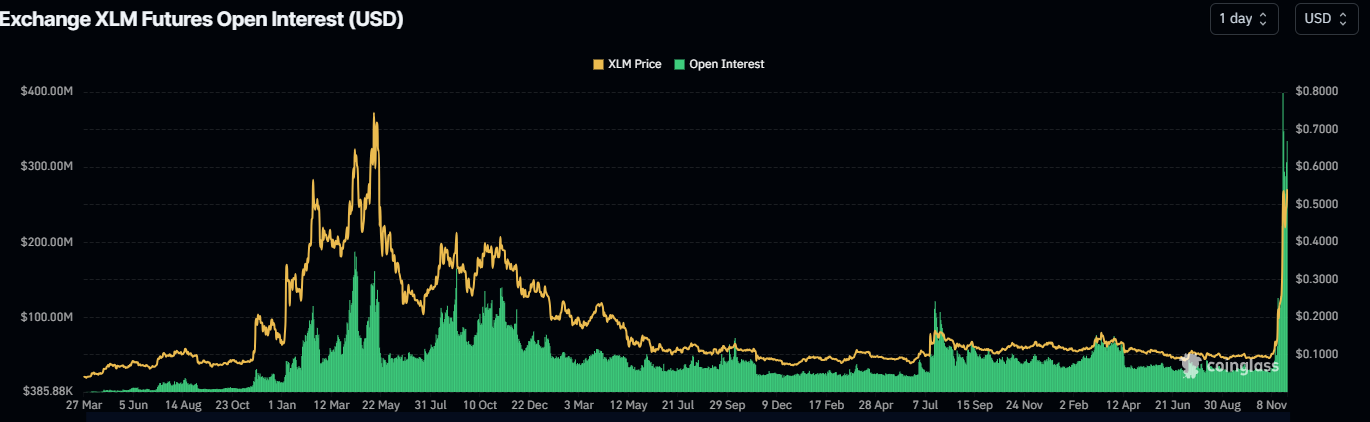
XLM Open Intetrst chart. Source: Coinglass
Despite bullish on-chain metrics and technical analysis, if the XLM weekly candlestick closes below $0.43, the bullish thesis will be invalidated, leading to a price decline to retest its next weekly support at $0.38.
Author

Manish Chhetri
FXStreet
Manish Chhetri is a crypto specialist with over four years of experience in the cryptocurrency industry.


