Stellar Price Analysis: XLM/USD vulnerable to sell-off before another attempt at $0.0700
- Stellar (XLM) has been gaining ground isnce June 27.
- The short0term correction will be followed by another bullish wave.

Stellar (XLM) is the 14th largest digital asset with the current market value of $1.3 billion and an average daily trading volume of $302 million. The coin has gained over 4% in the recent 24 hours amid strong upside momentum. XLM/USD bottomed at $0.0588 on June 27 and has been recovering ever since. The price hit the recent high at $0.0674 during early Asian hours before retreating to $0.0671 by press time.
XLM/USD: Technical picture
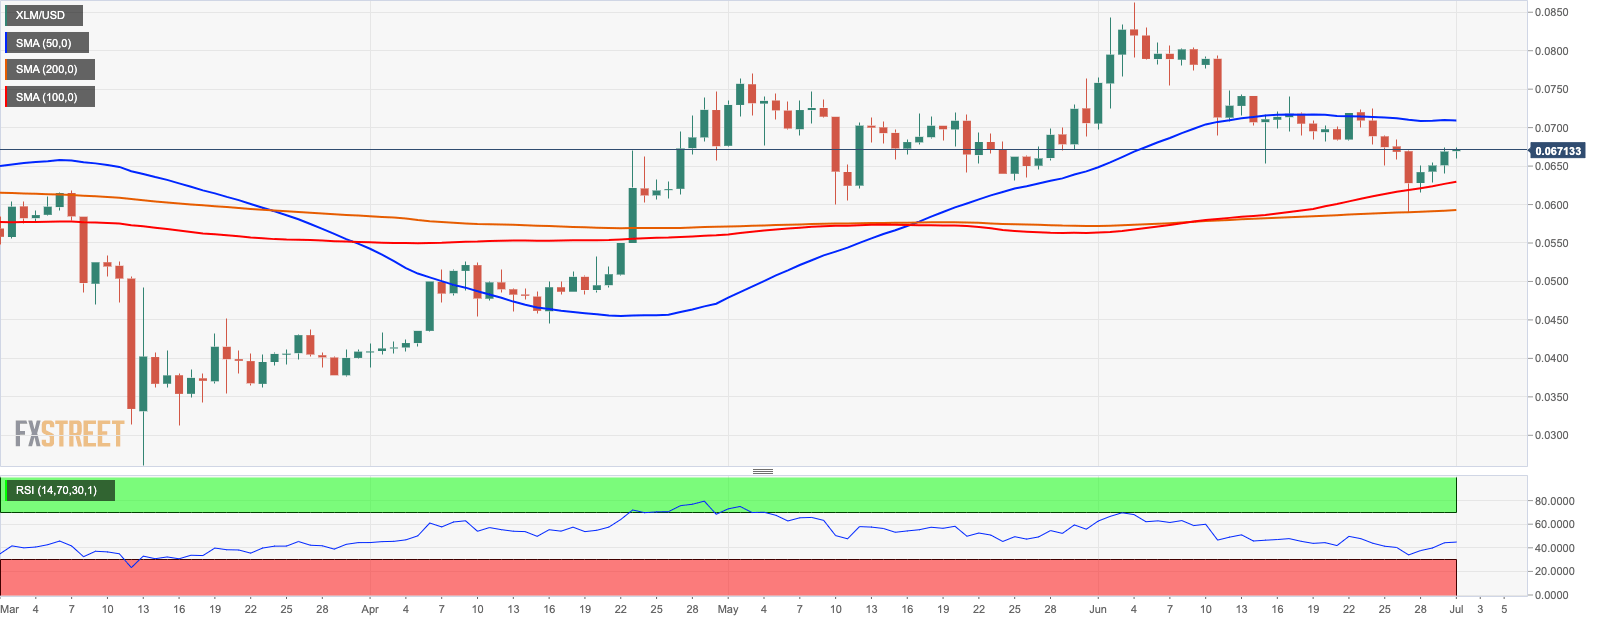
On a daily chart, XLM/USD is well-positioned for the further recovery towards $0.0700. This critical resistance is reinforced by daily SMA50, and once it is out of the way, the upside is likely to gain traction with the next focus on $0.0800 and $0.0863 (the highest level of 2020). This barrier stopped the recovery in the middle of June and has a potential to slow down the bullish momentum.
The RSI on a daily chart stays flat in a neutral position, which means the price may be vulnerable to range-bpund trading in the nearest future.
The support is created by the upside-looking daily SMA100 at $0.0630. This barrier is closely followed by SMA200 located on approach to psychological $0.0600. XLM/USD has been trading above this MA since the end of April, moreover, it stopped the bearish assault on June 27.
XLM/USD daily chart
On the intraday chart, XLM/USD broke above 1-hour SMA200 at $0.0667, which is a positive technical signal. However, the intraday RSI reversed to the downside, while the upside momentum has faded away after a failed attempt to test $0.0700. It means that the coin may be vulnerable to the short-term correction towards $0.0650 (1-hour SMA50 and SMA100) before another bullish wave.
XLM/USD 1-hour chart
-637291924266190137.png)
Author

Tanya Abrosimova
Independent Analyst


