- Solana price hit an all-time high at $57.69 on May 18 and is currently retracing.
- Depending on the market conditions, SOL pullback could extend up to 17%.
- Although unlikely, a breakdown of the 50% Fibonacci retracement level at $39.74 might put a dent in the upside narrative.
Solana price shows the exhaustion of the bullish momentum, which has led to a minor retracement to the immediate demand barrier. There is a chance that this support area might be breached, which will allow SOL to test a critical level before reversing.
Solana price temporarily halts its upward moves
Solana price is currently trading at $53.60, just above a demand zone that extends from $45.68 to $51.98. Judging by the weak market structure of cryptocurrencies, it is likely that SOL will retrace before heading to new highs.
Interestingly, the Momentum Reversal Indicator (MRI) flashed warnings in the form of a yellow ‘down arrow’ on the 12-hour chart. This technical formation indicates that further appreciation in Solana price could result in a red ‘one’ 12-hour candlestick, a cycle top.
If this were to happen, the reversal setup forecasts a one-to-four candlestick correction. Therefore, the short-term retracement that prevents the MRI from presenting a sell signal would help SOL in the long run.
The demand zone extending from $45.68 to $51.98 is the buyers’ first area of interest. Solana price could drop to the 61.8% Fibonacci retracement level at $44.14, which is approximately 17% away from its current position.
Investors can expect a reversal around this area, leading to a retest of the current all-time high at $57.69. If the bullish momentum persists, Solana price could rise 17% to tag the 127.2% Fibonacci extension level at $68.52, a new all-time high.
Under extreme buying pressure, SOL could set up new highs at the following areas of interest - $73.81 and $81.41.
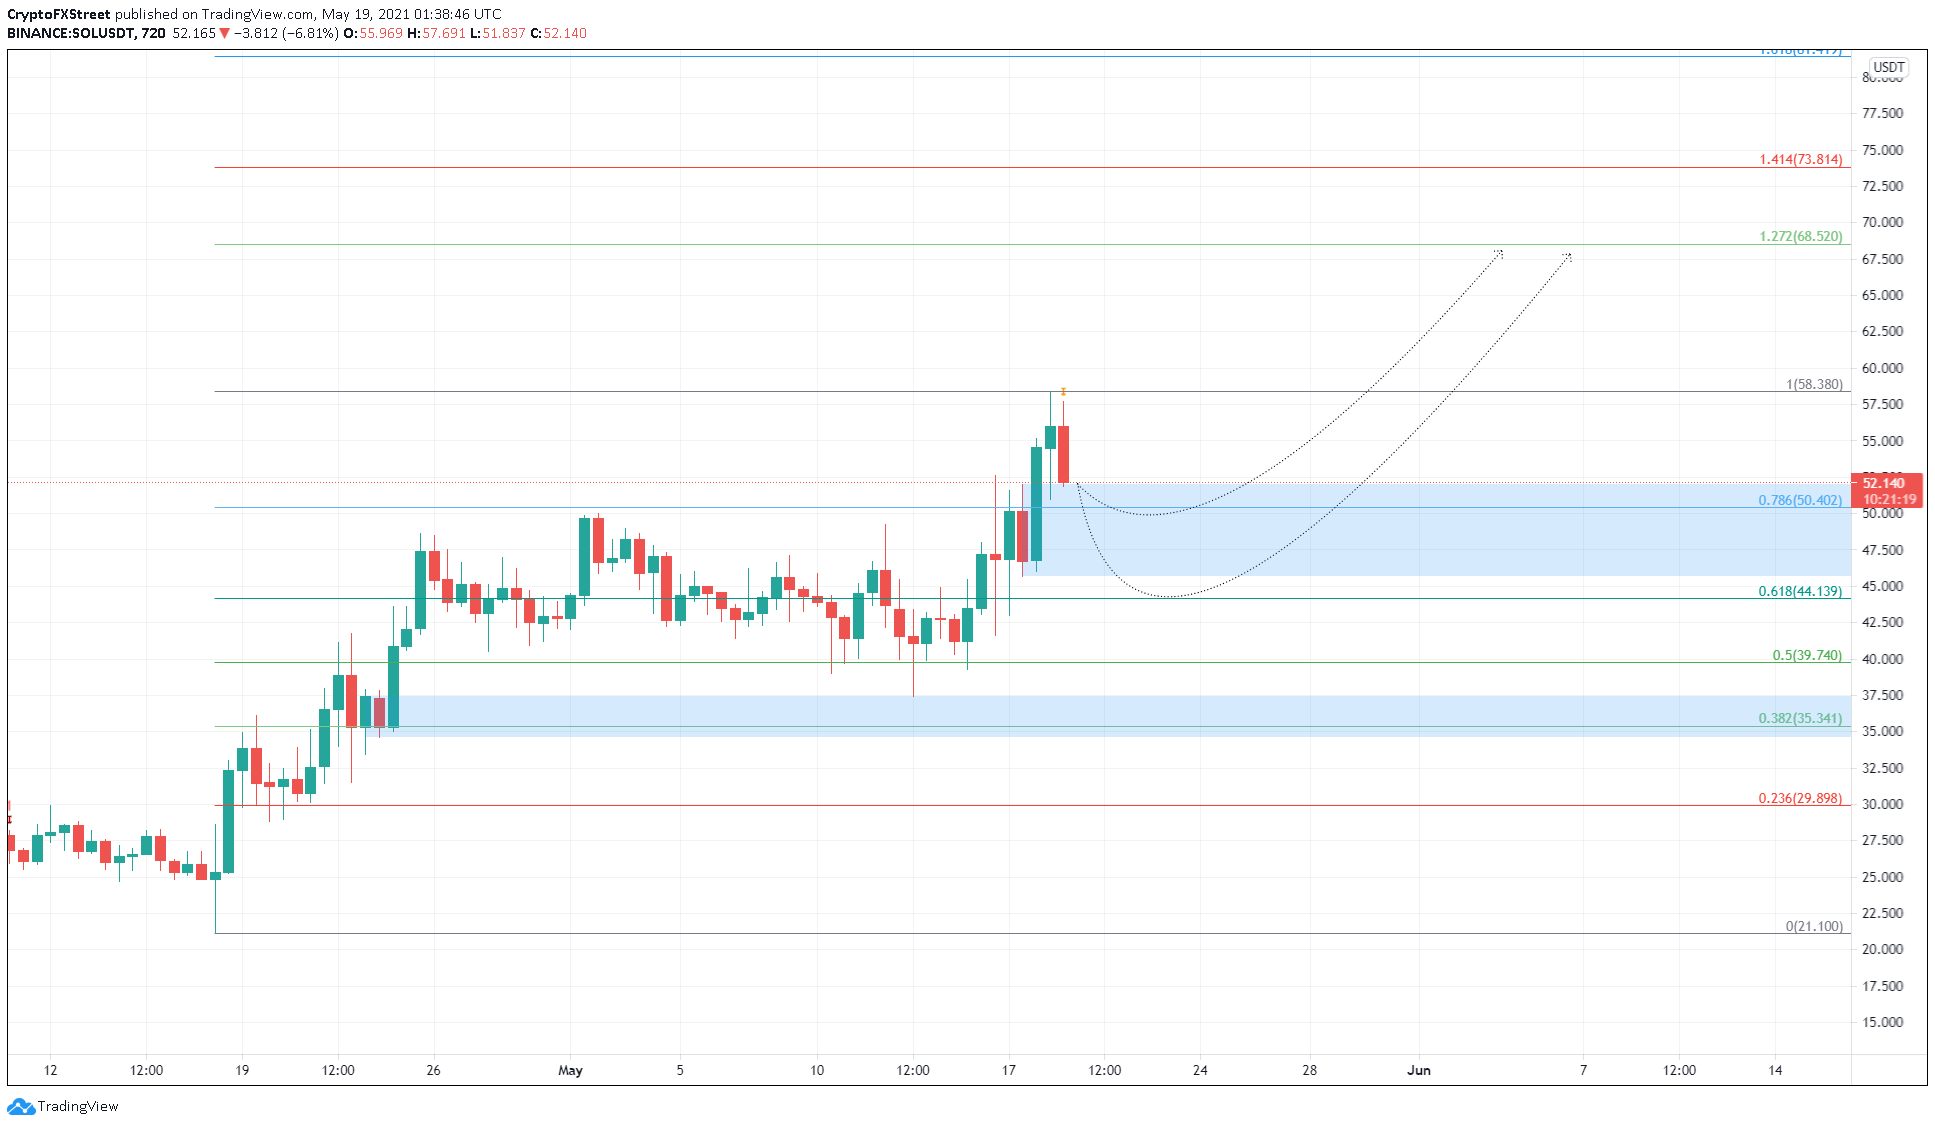
SOL/USDT 12-hour chart
While unlikely, a drop to the 50% Fibonacci retracement level at $39.74 could result in a sideways movement, especially if buyers lack the conviction to rescue SOL. Such a move would represent a 25% drop but not hurt the bullish thesis detailed above.
However, a breakdown of the 38.2% Fibonacci retracement level at $35.34 would invalidate the optimistic outlook and trigger a 15% crash to $29.89.
Information on these pages contains forward-looking statements that involve risks and uncertainties. Markets and instruments profiled on this page are for informational purposes only and should not in any way come across as a recommendation to buy or sell in these assets. You should do your own thorough research before making any investment decisions. FXStreet does not in any way guarantee that this information is free from mistakes, errors, or material misstatements. It also does not guarantee that this information is of a timely nature. Investing in Open Markets involves a great deal of risk, including the loss of all or a portion of your investment, as well as emotional distress. All risks, losses and costs associated with investing, including total loss of principal, are your responsibility. The views and opinions expressed in this article are those of the authors and do not necessarily reflect the official policy or position of FXStreet nor its advertisers. The author will not be held responsible for information that is found at the end of links posted on this page.
If not otherwise explicitly mentioned in the body of the article, at the time of writing, the author has no position in any stock mentioned in this article and no business relationship with any company mentioned. The author has not received compensation for writing this article, other than from FXStreet.
FXStreet and the author do not provide personalized recommendations. The author makes no representations as to the accuracy, completeness, or suitability of this information. FXStreet and the author will not be liable for any errors, omissions or any losses, injuries or damages arising from this information and its display or use. Errors and omissions excepted.
The author and FXStreet are not registered investment advisors and nothing in this article is intended to be investment advice.
Recommended Content
Editors’ Picks

Ethereum Price Forecast: ETH ETFs post first weekly inflows since February
Ethereum ETFs recorded net inflows of $104.1 million on Friday — their highest daily inflow since February 4, per SoSoValue data. As a result, the products saw a weekly net inflow of $157.1 million, which also marks their highest net buying activity since February.

Defi Development Corporation files to offer $1 billion in securities to boost its Solana holdings
Defi Development Corporation filed a registration statement with the Securities & Exchange Commission on Friday, signaling its intent to offer and sell a wide range of securities.

Bitwise hints at NEAR ETF following Delaware registration
The filing marks a crucial step before a firm submits an application for an ETF with the SEC. While Bitwise has not yet applied for a NEAR ETF with the SEC, similar actions preceded its previous XRP and Aptos ETF filings.

Bitcoin price could reach $285K by 2030 as Citigroup forecasts $1.6 trillion stablecoin inflows
Bitcoin price outlook strengthens as Citigroup projects $1.6 trillion stablecoin growth, calling them critical bridges between banks and blockchain.

Bitcoin Weekly Forecast: BTC consolidates after posting over 10% weekly surge
Bitcoin (BTC) price is consolidating around $94,000 at the time of writing on Friday, holding onto the recent 10% increase seen earlier this week.

The Best brokers to trade EUR/USD
SPONSORED Discover the top brokers for trading EUR/USD in 2025. Our list features brokers with competitive spreads, fast execution, and powerful platforms. Whether you're a beginner or an expert, find the right partner to navigate the dynamic Forex market.