Solana price heads to $110 after being extremely oversold
- Solana price completes 50% retracement from the 2021 rally.
- Strong support was found near the $90 value area.
- Extreme oversold conditions indicate a pullback in the form of a relief rally is imminent.

Solana price, like the majority of the cryptocurrency market, has experienced significant loss. SOL is down 69% from the all-time high, but a sizeable retracement of that loss is coming up.
Solana price poised to test resistance at $110
Solana price has lost nearly 45% from last week's open, moving from $146 to the current weekly low at $80. However, a significant amount of buying support poured into SOL near the 50% Fibonacci retracement at $91 and since hitting that Fibonacci zone, buyers have been in control and maintaining a steady rise over the past two trading days.
It is very likely that a significant swing low for Solana price has been established – one that will be a launching point for another run towards new all-time highs. The Relative Strength Index is oversold on the weekly and daily charts. Likewise, the Composite Index oscillator has hit new all-time lows on the weekly chart, while the daily Composite Index created the second-lowest low in its history.
Another factor adding to the probability of a broader bullish reversal is the current weekly candlestick pattern. A Bullish Hammer candlestick pattern is one of the most sought-after bullish reversal patterns in Japanese analysis. Given the extreme oversold nature of Solana price and the length of its current downtrend, if the bullish hammer pattern completes on the weekly chart, then SOL is poised for some nice gains ahead.
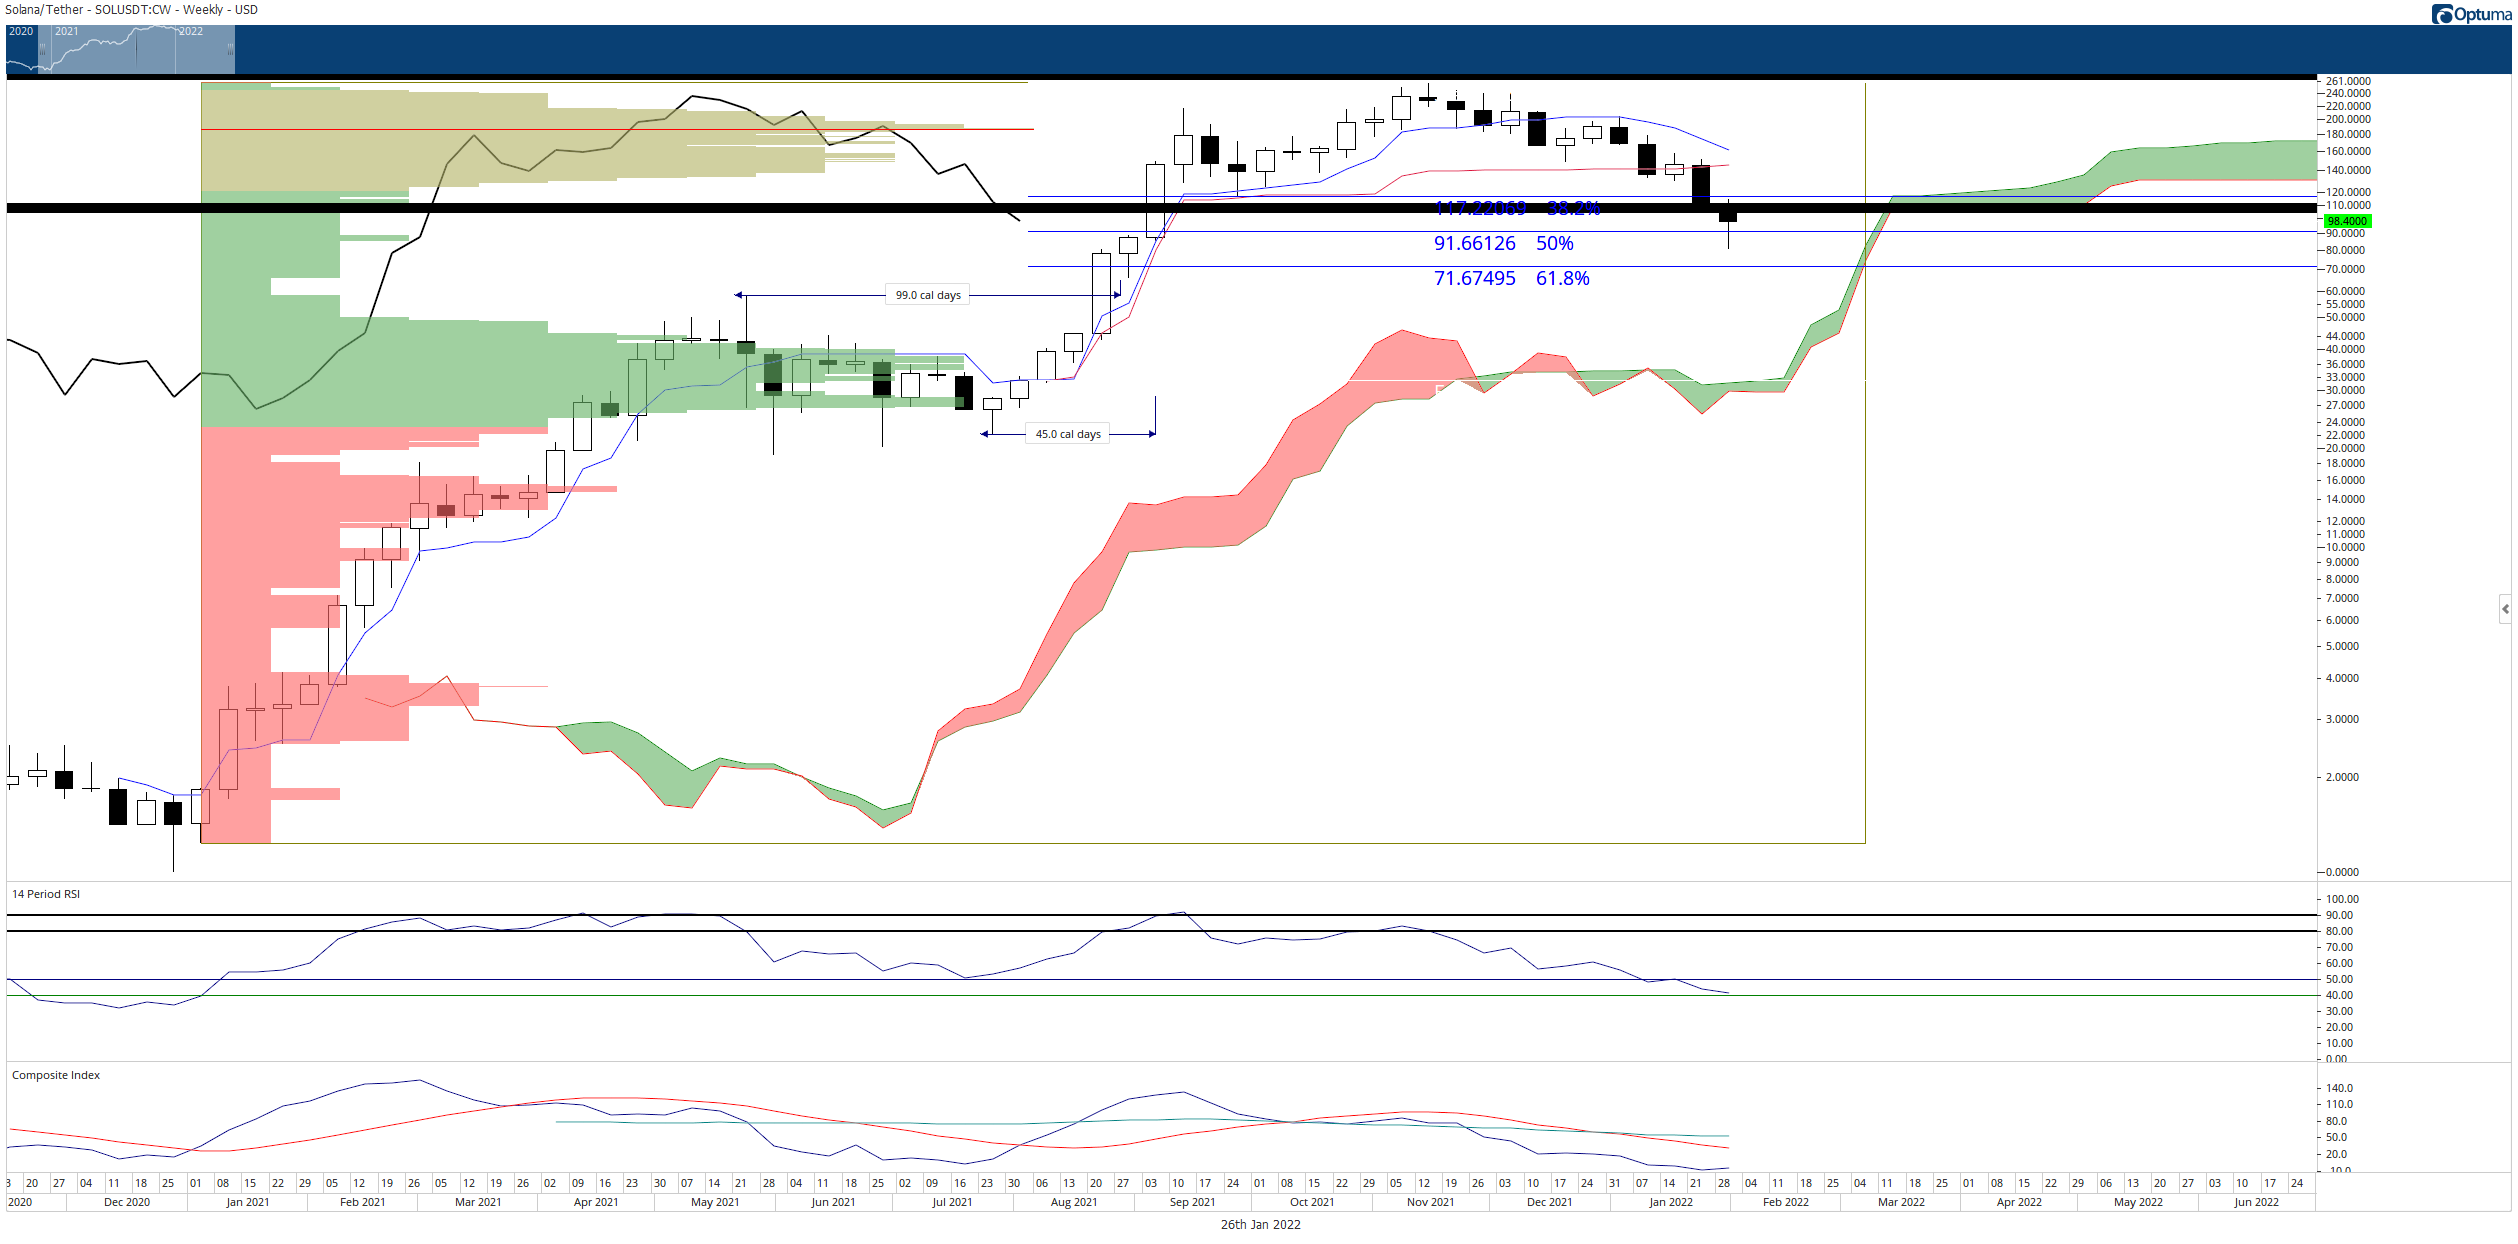
SOL/USDT Weekly Ichimoku Kinko Hyo Chart
Before any sustained rally can be triggered and maintained, however, a series of resistance levels will be tested. The first is at the $110 value area, which contains a cluster of prior Fibonacci confluence zones (thick black line) and a high volume node in the Volume Profile. If bulls can push Solana price and hold it above $110, then the road to retest $150 becomes more manageable.
Any weekly close below the 50% Fibonacci level at $91 would invalidate any near-term bullish bias.
RELATED CONTENT
MATIC price shows bullish signs of complete recovery
MATIC price is set for a sizable bullish reversal of the downtrend that occurred the past few days as Polygon’s trend channel got broken to the downside. With that correction, bulls were able to stop and turn the descent around $1.40 and push the price back towards the 200-day Simple Moving Average (SMA) at $1.63. With that move, the Relative Strength Index (RSI) bounced off the border of being oversold and made a bullish knee-jerk reaction. Expect to see this rally going into the Fed rate decision later today. If that decision falls in line with market expectations or holds a slight dovish message, expect investors to join in big numbers, pushing up buying volume and leading to a massive breakout trade that could touch $1.75 and the monthly S1 support level in a first phase. After that, expect buying to persist going into the late US close and even see price action fully regain the incurred losses towardsRead more
Author

Jonathan Morgan
Independent Analyst
Jonathan has been working as an Independent future, forex, and cryptocurrency trader and analyst for 8 years. He also has been writing for the past 5 years.


