Solana Price Forecast: Traders move 6.7B SOL as bulls target all-time highs
- Solana price fell to $230 on Wednesday, down 8% from its 3-year peak of $248 recorded on Monday.
- Market demand for Solana dipped 52% in the last 72 hours, dropping from 9.9 billion to 6.7 billion SOL.
- In the derivatives markets, funding rates declined 50%, while open interest rose $630 million, signaling an influx of short positions.
Solana price has succumbed to a 7% dip after rejecting the $250 resistance on Monday. Negative shifts in vital trading indicators suggest bears could delay the all-time high breakout target.
Solana retraces toward $230, after failed all-time high breakout attempt
On November 14, Solana price rose to a 3-year high of $248 amid rising memecoin demand and positive speculations around VanEck’s SOL spot ETF applications. Notably, the rally saw Solana price come within 5% of crossing its all-time high of $259 recorded in November 2021.
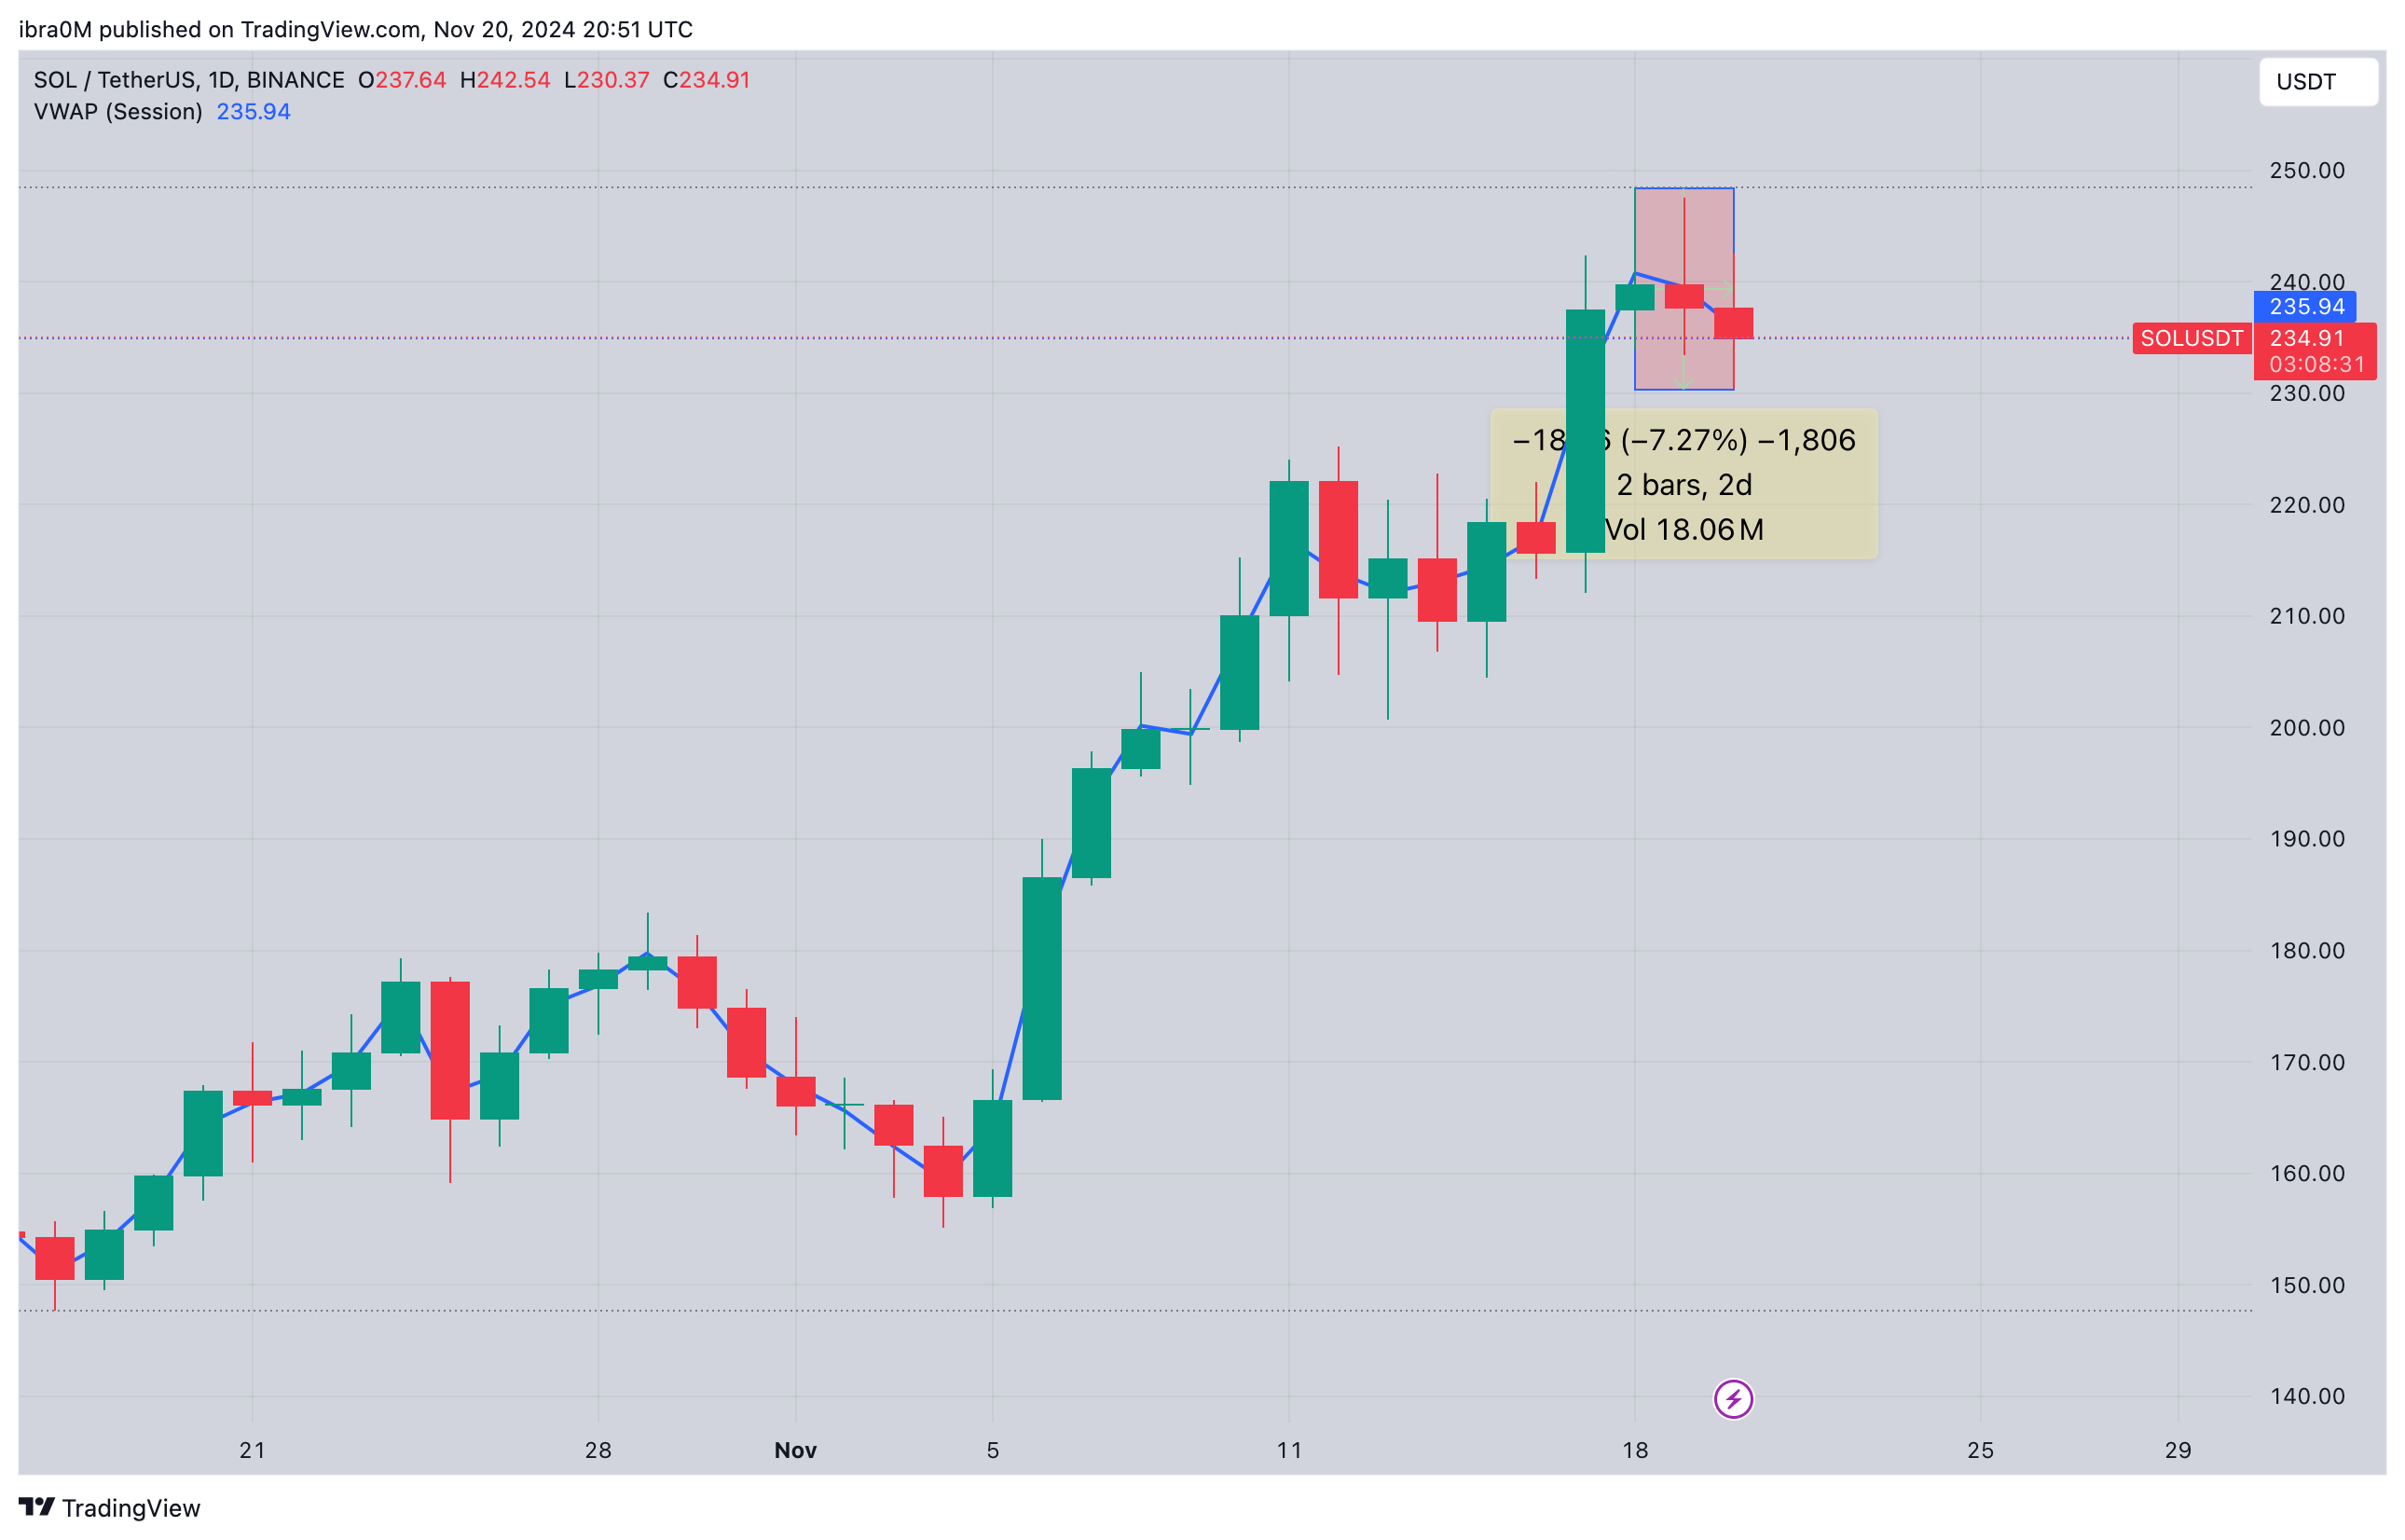
Solana price analysis | SOLUDST
The chart above shows that Solana traded as low as $230 within the daily timeframe on Wednesday, reflecting a 7% decline from last week's top.
Solana’s price stagnation over the last 48 hours has seen it slip behind XRP to rank fourth.
Market demand for SOL dipped 52% amid price correction
While Solana still maintains relatively high support levels, vital trading indicators suggest the bullish momentum is losing steam.
Affirming this narrative, the Santiment chart below, tracks the volume of SOL coins traded daily.
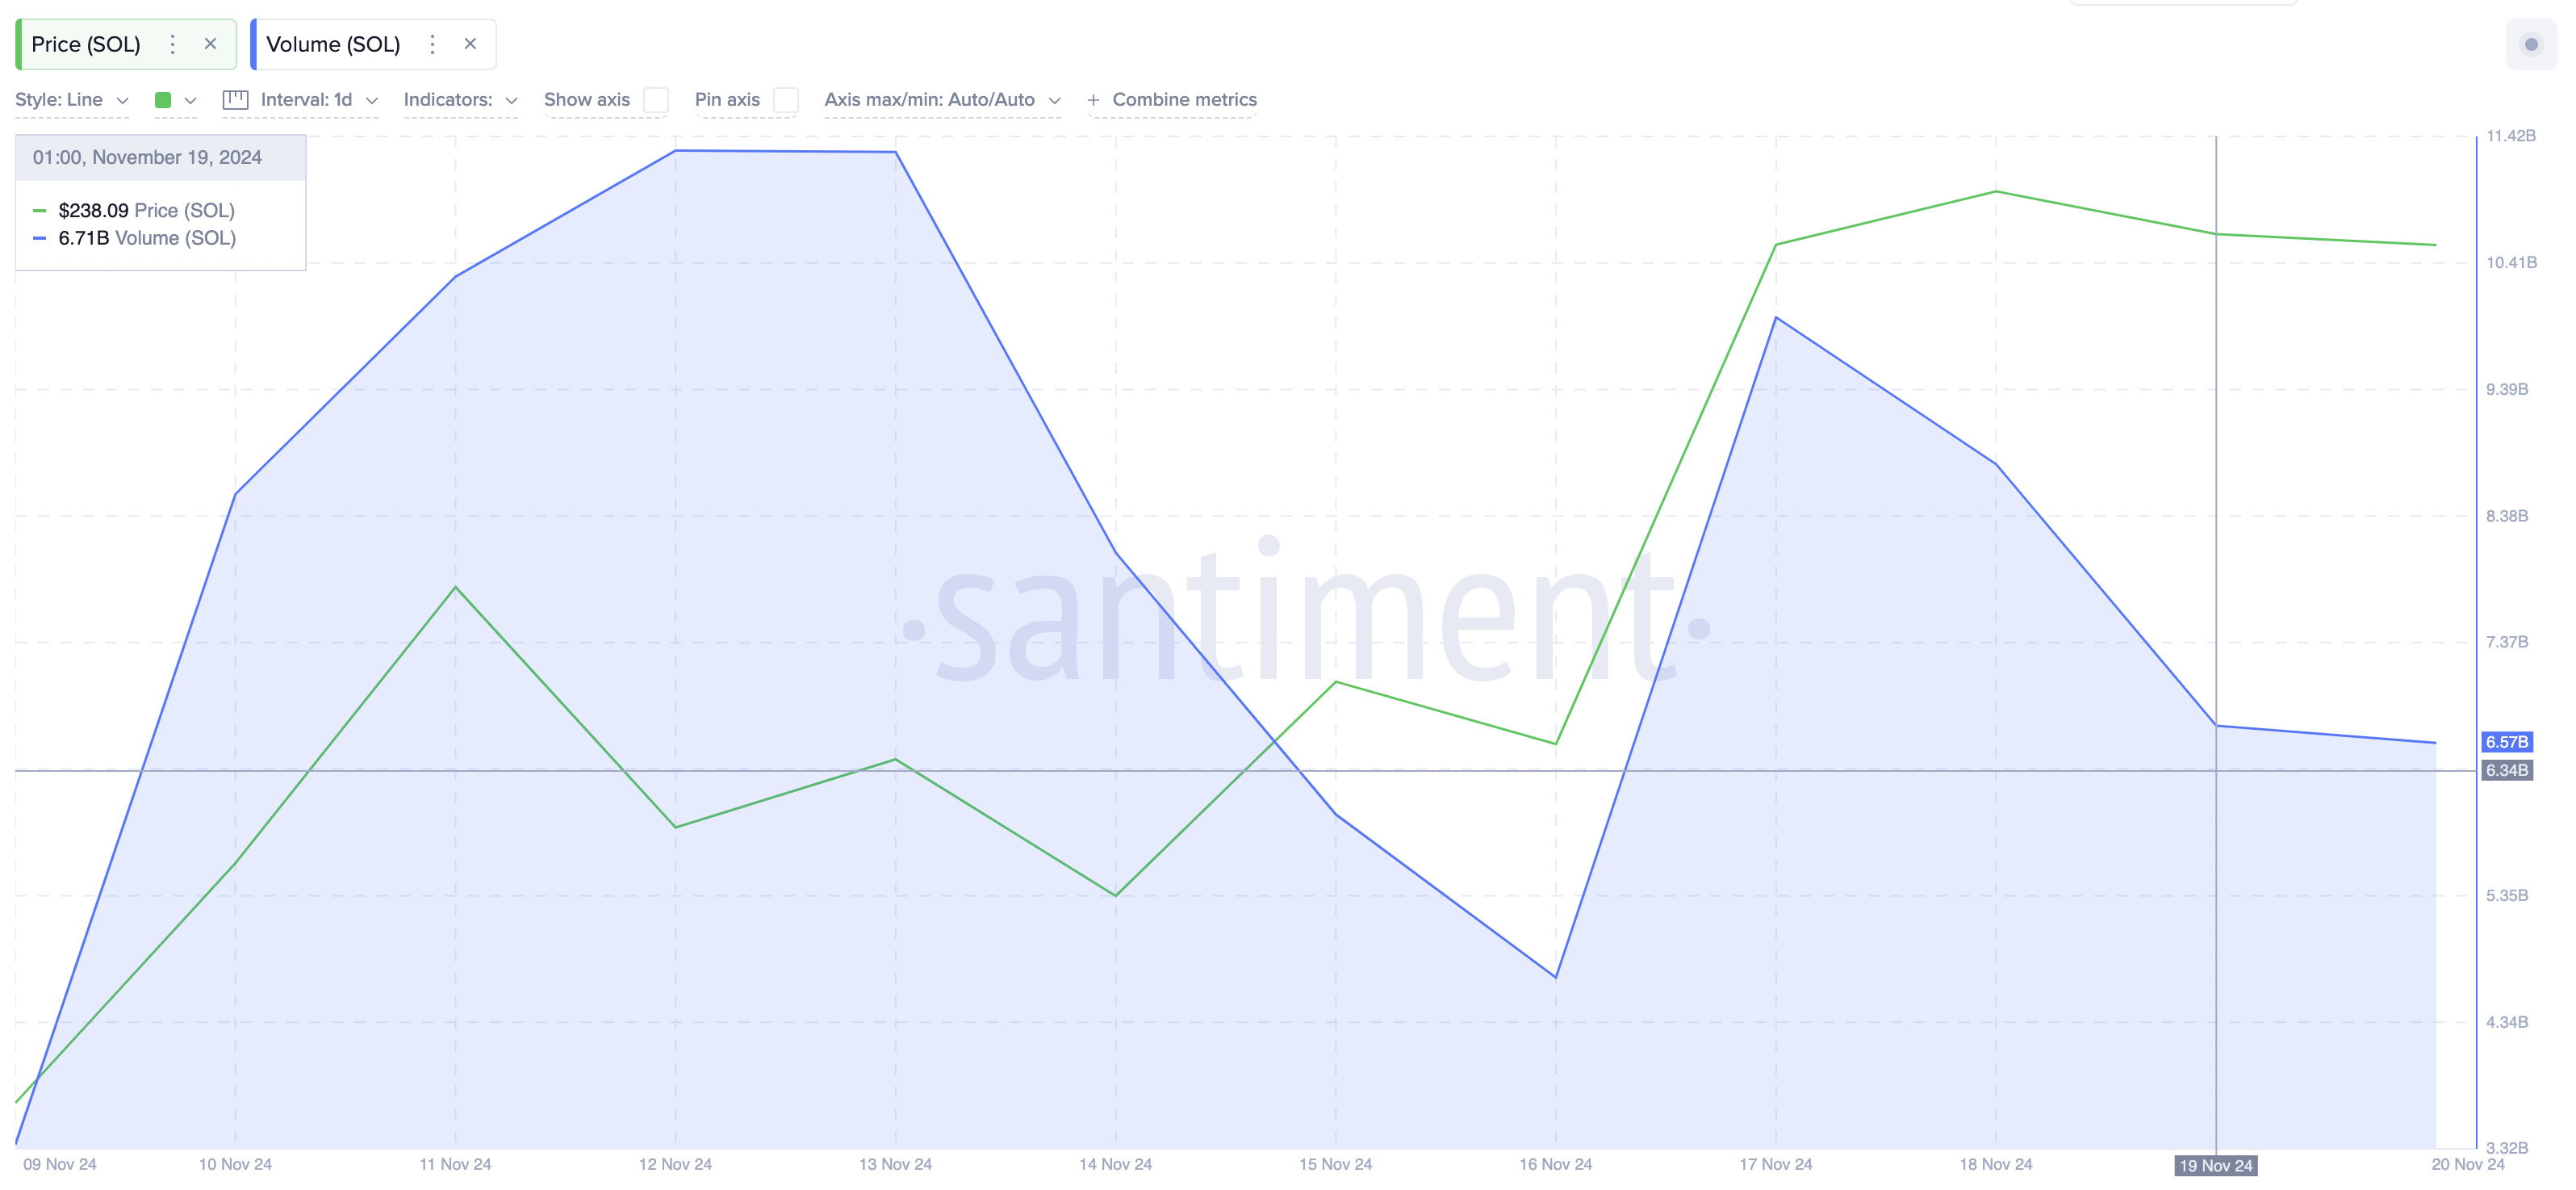
Solana trading volume | Source: Santiment
As seen above, over 9.9 billion SOL were traded on November 17, the second-highest daily volume in the past 90 days dating back to August 5.
However, after facing rejection at the $250 resistance level, market demand for Solana has declined considerably.
According to the latest data, investors traded only 6.7 billion SOL on November 19, reflecting a sharp 52% drop in trading volume over 48 hours.
Such a significant decline during a price consolidation phase may catalyze bearish sentiment for two key reasons.
First, it signals reduced market confidence among short-term traders which could potentially weaken the upward price momentum.
Without a strong recovery in demand, this could make Solana vulnerable to further price corrections, especially if volumes drop further in the days ahead.
Short traders mount pressure as funding rates drop 50%
While trading volumes have declined by 52% amid the ongoing consolidation phase, Solana short traders are making strategic moves to regain market dominance.
The Coinglass charts below depicts open interest and funding rate trends, two vital metrics for monitoring trading sentiment among short-term speculative traders.
While the open interest metric tracks total capital stock invested in solana futures markets, the funding rate data shows directional changes in fees paid between short and long position holders.
-638677345125369932.png)
As depicted above, Solana's funding rate dropped from 0.04 on Monday to hit the 0.02 mark at the time of publication on November 20, coinciding with a $630 million increase in open interest.
This reflects that bull traders have scaled down leverage deployed on their SOL long positions by 50% over the last two days.
When a funding rate decline is accompanied by an increase in open interest, it signals an influx of short positions.
With the majority of short-term speculative traders betting on further downswings, Solana price new all-time high prospects could stall.
Solana price forecast: $230 support at risk
With bears dominating the derivatives markets, Solana daily chart shows mild-bearish signals, with key technical indicators showing that $230 support level could be at risk.
First, the Bollinger Bands (BB) reflect significant tightening inwards, indicating reduced volatility, which often precedes a major reversal.
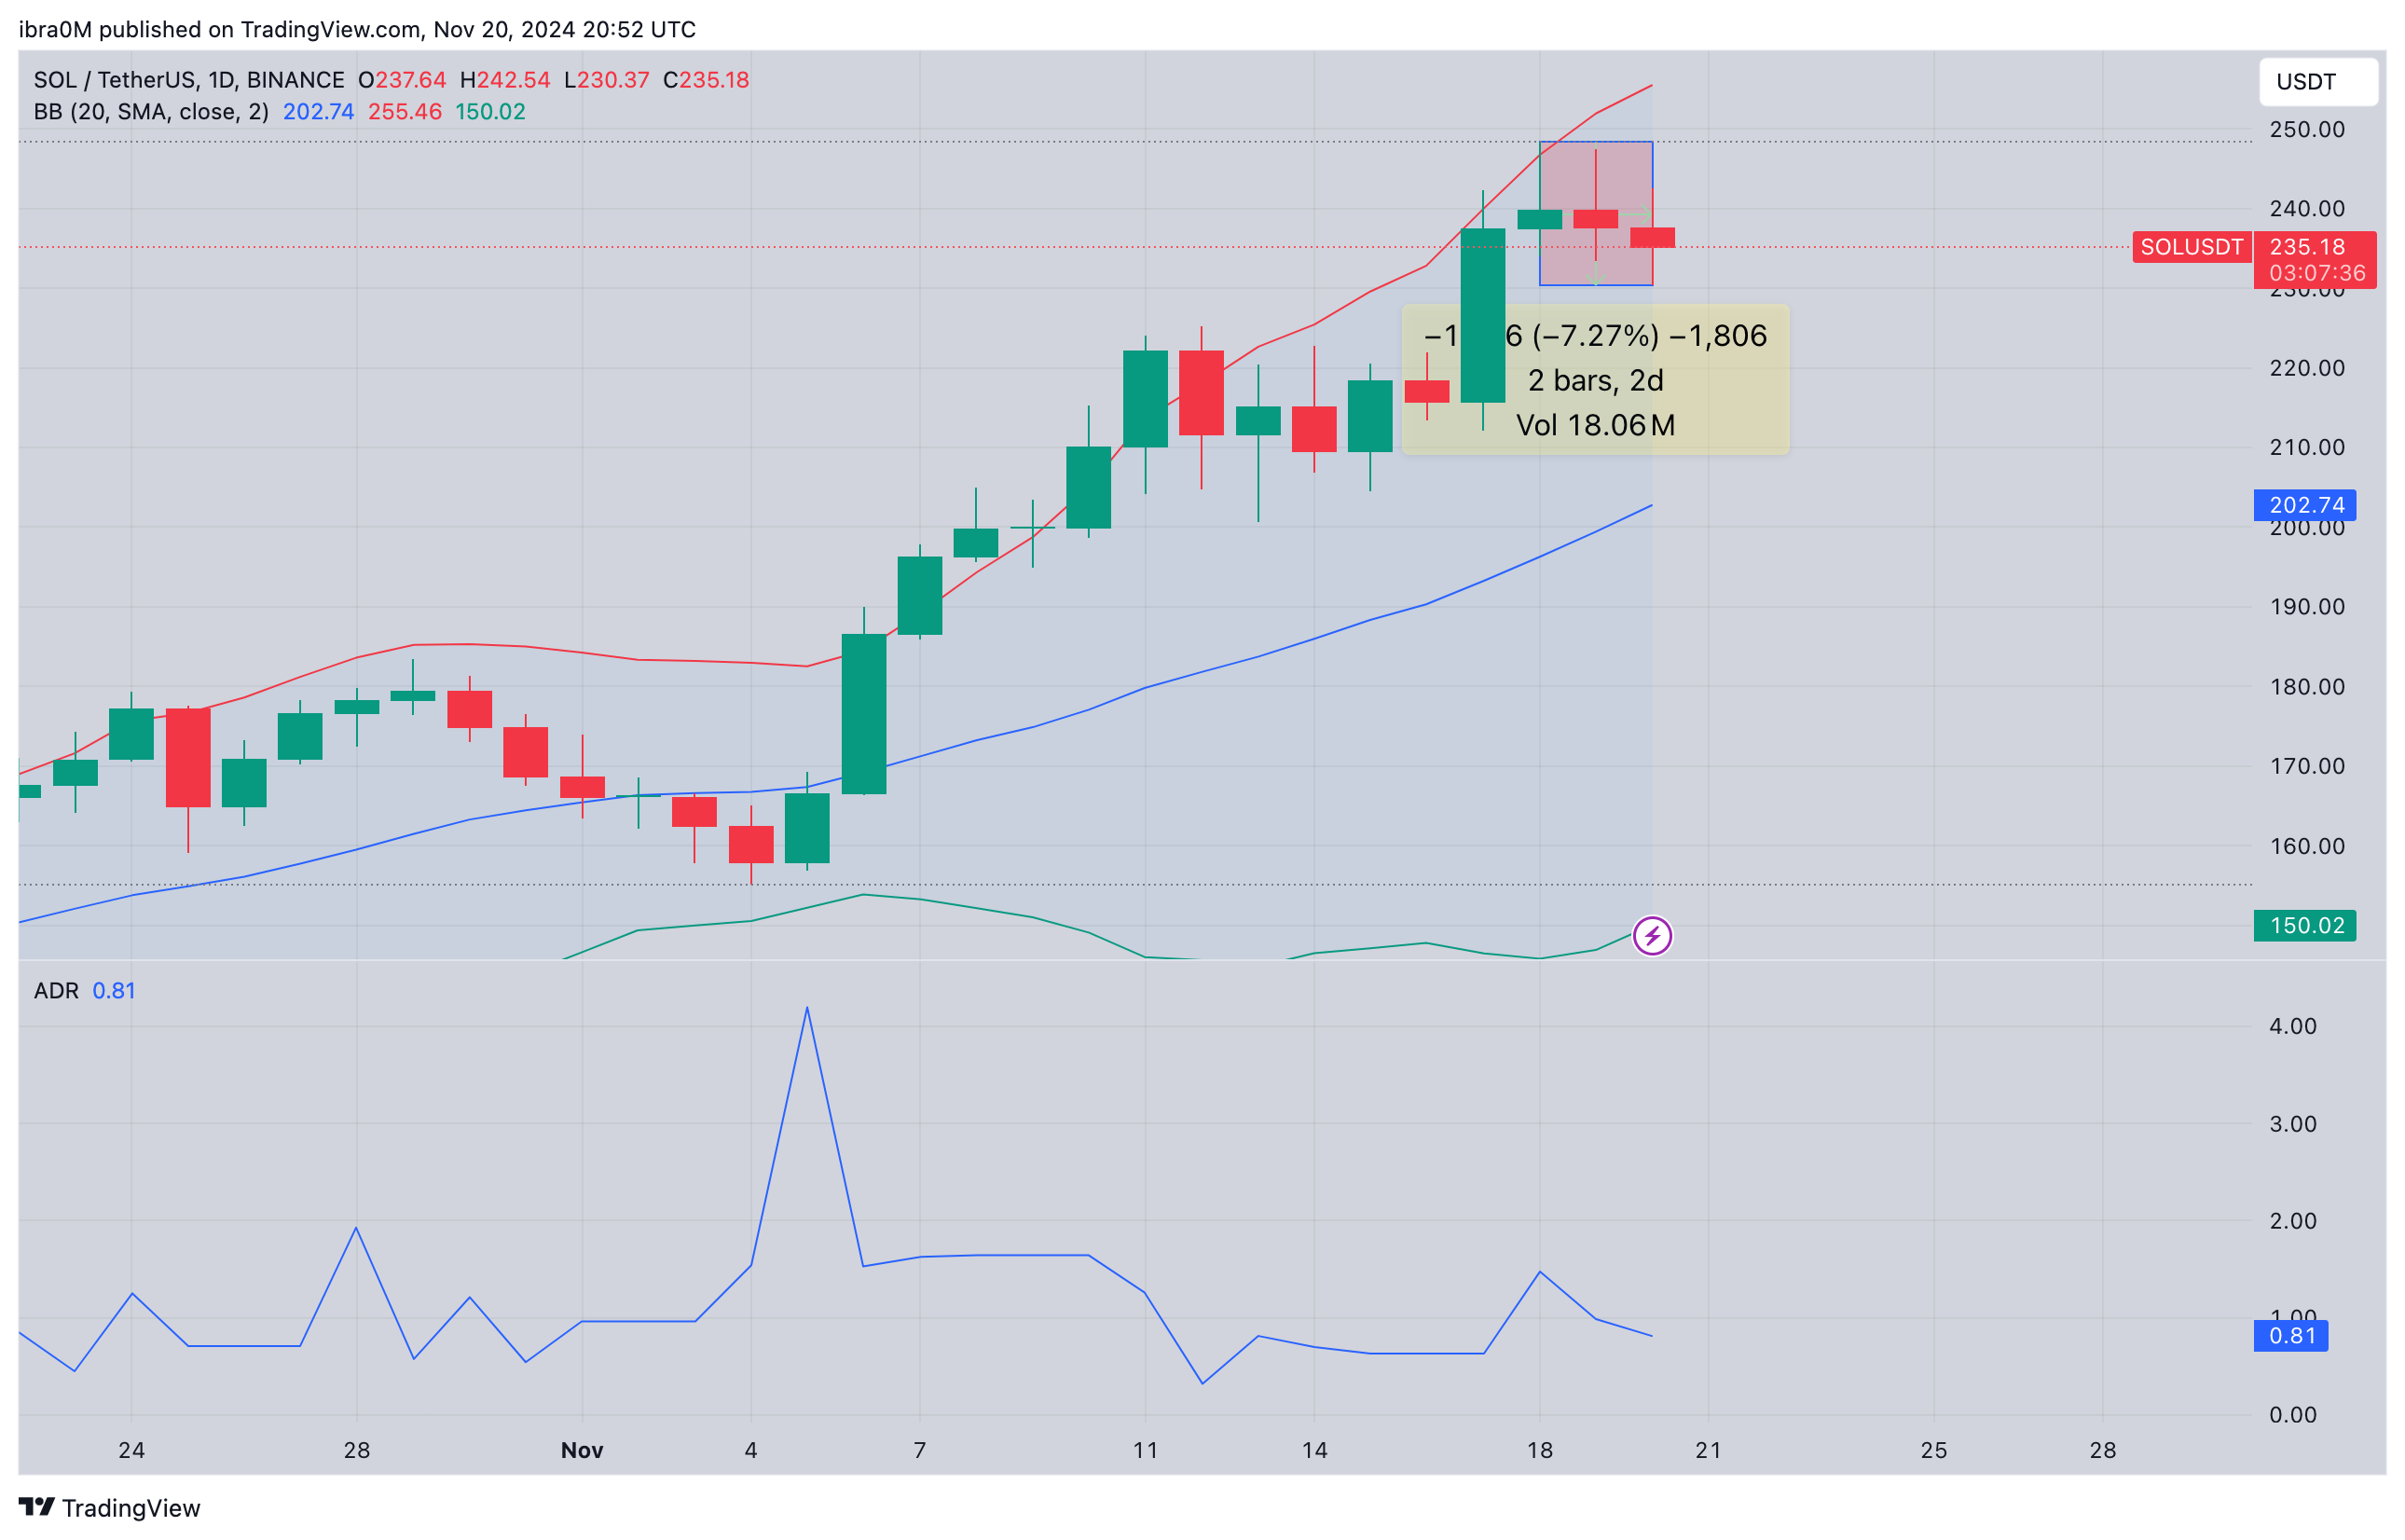
Solana price forecast | SOLUSD
In confirmation of the bearish outlook, Solana’s Average Directional Index (ADX) has also dropped to 0.81, signaling weakening trend strength. This reflects waning bullish momentum, exacerbating concerns that Solana might struggle to reclaim its recent highs.
If sellers gain further control, Solana price could lose the $230 support, heightening risk of potential decline toward the next major support at $202, aligning with the 50-day Simple Moving Average (SMA).
To regain bullish traction, SOL price must close above the $230 level.
In this scenario, a surge in trading volumes could potentially push prices back above $240. However, failure to hold $230 will likely validate bearish sentiment, potentially triggering a retest of deeper support zones.
Author

Ibrahim Ajibade
FXStreet
Ibrahim Ajibade is an accomplished Crypto markets Reporter who began his career in commercial banking. He holds a BSc, Economics, from University of Ibadan.


