Solana Price Forecast: SOL big picture to flip bullish soon, all eyes on $26
- Solana price trades around $21.2 with a shift in trend favoring bulls.
- The outlook for SOL seems burgeoningly bullish on the three-day chart.
- A flip of the $25.8 hurdle into a support floor is likely to kickstart a 43% rally to $37.1.
- A three-day candlestick close that flips the $17.5 support level will invalidate the bullish thesis.

Solana (SOL) price seems to be undoing the bearish pressure that has kept it subdued all this time. The recent spike in buying pressure has pushed SOL to produce a higher high on the three-day chart, signaling a shift in momentum favoring bulls.
Also read: This altcoin nears the end of its five-month downtrend and could rally 40% soon
Solana price edges closer to a volatile move
Solana (SOL) price trades at $21.2 after producing a decisive three-day candlestick close above the 13-day, 25-day and 30-day Exponential Moving Averages (EMA) in the $20-region. This move has also produced a higher high relative to the September 19 swing high of $20.54.
While the Solana price action is bullish, no doubt, the momentum indicators – Relative Strength Index (RSI) and Awesome Oscillator (AO) are also showing signs of improvement. The RSI, in particular, has flipped above the 50 mean level on the three-day chart, signaling that the strength of bulls is on the rise, The AO, however, is still below the zero mean level, lagging behind RSI. Traders need to keep a close eye on this index as a flip above the zero level could trigger a volatile move in SOL to the upside.
The first target for SOL traders is the $25.8 level, which is roughly 22% away from the current level and is a good trader for short-term investors. But the $25.8 barrier is key from a long-term perspective; a flip of this hurdle into a support floor on the three-day chart could catalyze a 43% rally in Solana price to $37.1. This move would constitute a 76% gain from the current level.
Read more: Solana price sustains recovery rally despite falling daily active addresses
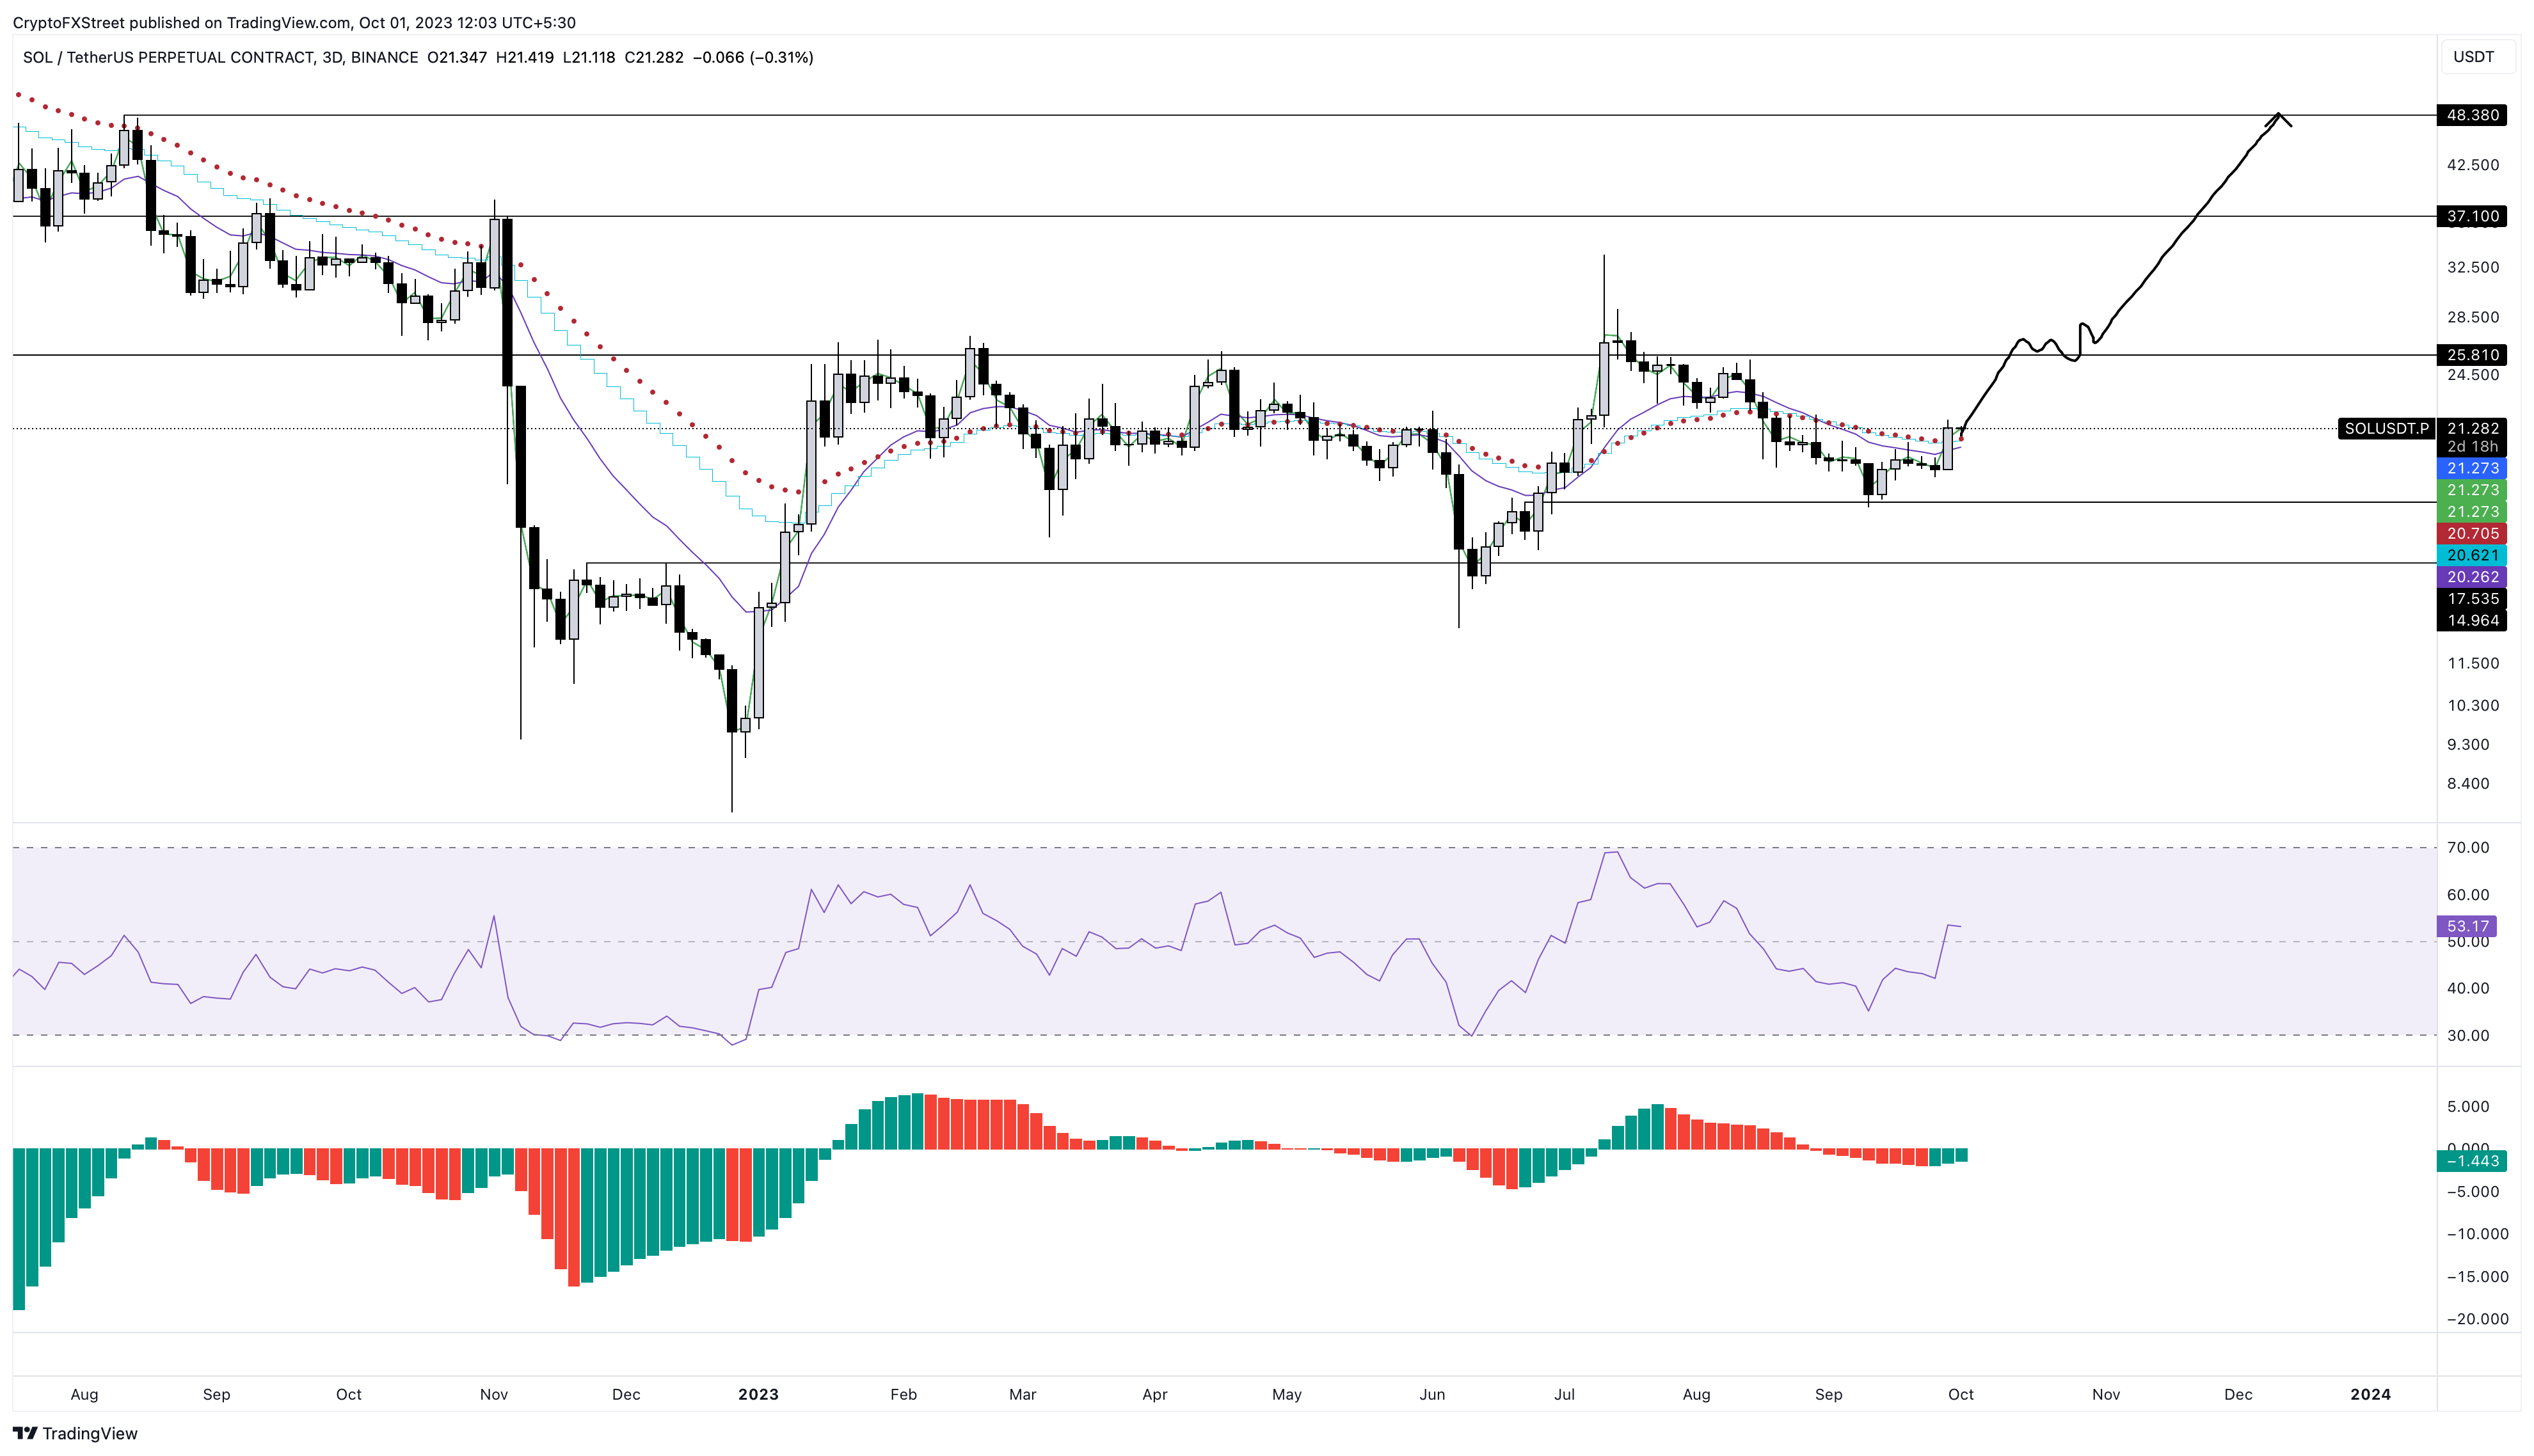
SOL/USDT 3-day chart
While the optimistic outlook for Solana makes logical sense, considering the recent price action and momentum indicators, investors need to be cautious. A sudden spike in selling pressure that pushes SOL to produce a three-day candlestick close below the $17.5 support level will create a lower low and invalidate the bullish thesis.
In such a case, Solana price could crash nearly 15% and revisit the $14.9 foothold.
Read more: Solana Price Forecast: SOL can rally 14% if RSI can reclaim this level
Author

Akash Girimath
FXStreet
Akash Girimath is a Mechanical Engineer interested in the chaos of the financial markets. Trying to make sense of this convoluted yet fascinating space, he switched his engineering job to become a crypto reporter and analyst.


