Solana price sustains recovery rally despite falling daily active addresses
- Solana price sustains recovery rally, but daily active addresses doesn’t mirror this outlook.
- Solana Foundation's head of strategy Austin Federa attributes this disparity to reduced bots as human users continue to abound.
- With human users’ wallets paying fees and retention data still strong, SOL could continue the rise.

Solana (SOL) price shows strong bullish momentum, which has seen the Ethereum (ETH) killer break out from a descending parallel channel. Strangely, the daily active addresses on-chain metric fails to mirror this optimism, which is unorthodox considering the two parameters conventionally to go hand in hand.
Also Read: If Solana price fails to break trend, longs likely to suffer
Solana price loses parity with daily active addresses metric
Solana (SOL) price is on a steady recovery rally after a 45% slide as the altcoin consolidated within a bearish technical formation. However, after finding support at $17.29, SOL continue to nurture a recovery rally steered by bullish momentum from the demand zone indicated by a green order block in the chart below at around the $18.00 psychological level.
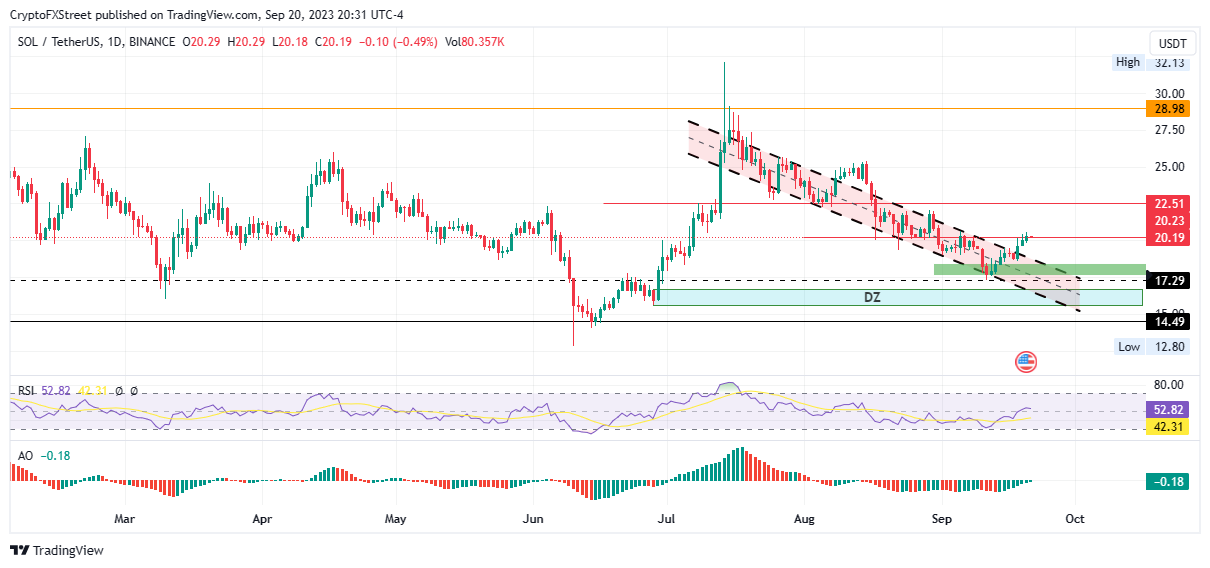
SOL/USDT 1-day chart
With momentum indicators such as the Relative Strength Index (RSI) and the Awesome Oscillator (AO) indicating rising momentum, Solana price could continue north.
However, there are concerns about the volume of the number of daily active addresses failing to mirror the optimism indicated by Solana price.
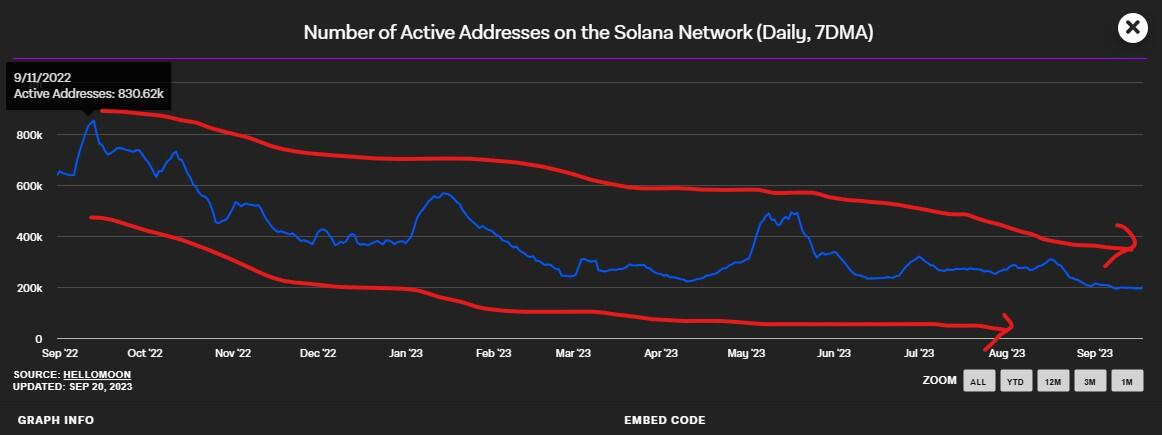
SOL daily active addresses
Speaking to The Block, Solana Foundation's head of strategy Austin Federa attributed the disparity to reduced bots as human users continue to abound.
According to Federa, the number of daily active users has reduced because of the elimination of bots running on the Solana network. Meanwhile, actual humans, who represent wallets paying network fees, are the ones driving the recovery rally, with their numbers displaying the actual retention data.
Reduced bots on Solana
Federa explains that recent network upgrades have led to the elimination of economic incentives for bots to operate on the Solana network. Without incentives, the bots have reduced significantly.
He also attributes the reduced bots to the Solana network introducing a feature similar to the one on Ethereum, where traders using bots for arbitrage of NFT minting can now pay a priority fee instead of using the bots.
Solana transaction fees
Meanwhile, Solana transaction fees paint a different picture. Notably, transaction fees is a better metric for determining an assets directional bias as it depicts a better picture of the amount of capital users are willing to pay for using a blockchain at any given time.
SOL transaction fees
Data from DeFiLlama shows a steady increase in transaction fees on the Solana network between November 2022 and September 2023, moving from $23,680 to the current $46,430. This represents a 96% rise in ten months.
Cryptocurrency metrics FAQs
What is circulating supply?
The developer or creator of each cryptocurrency decides on the total number of tokens that can be minted or issued. Only a certain number of these assets can be minted by mining, staking or other mechanisms. This is defined by the algorithm of the underlying blockchain technology. Since its inception, a total of 19,445,656 BTCs have been mined, which is the circulating supply of Bitcoin. On the other hand, circulating supply can also be decreased via actions such as burning tokens, or mistakenly sending assets to addresses of other incompatible blockchains.
What is market capitalization?
Market capitalization is the result of multiplying the circulating supply of a certain asset by the asset’s current market value. For Bitcoin, the market capitalization at the beginning of August 2023 is above $570 billion, which is the result of the more than 19 million BTC in circulation multiplied by the Bitcoin price around $29,600.
What is trading volume?
Trading volume refers to the total number of tokens for a specific asset that has been transacted or exchanged between buyers and sellers within set trading hours, for example, 24 hours. It is used to gauge market sentiment, this metric combines all volumes on centralized exchanges and decentralized exchanges. Increasing trading volume often denotes the demand for a certain asset as more people are buying and selling the cryptocurrency.
What is funding rate?
Funding rates are a concept designed to encourage traders to take positions and ensure perpetual contract prices match spot markets. It defines a mechanism by exchanges to ensure that future prices and index prices periodic payments regularly converge. When the funding rate is positive, the price of the perpetual contract is higher than the mark price. This means traders who are bullish and have opened long positions pay traders who are in short positions. On the other hand, a negative funding rate means perpetual prices are below the mark price, and hence traders with short positions pay traders who have opened long positions.
Author

Lockridge Okoth
FXStreet
Lockridge is a believer in the transformative power of crypto and the blockchain industry.


