This altcoin nears the end of its five-month downtrend and could rally 40% soon
- Radiant Capital price is trading inside a falling wedge pattern.
- This technical setup has triggered a breakout, and RDNT could rally soon.
- A daily candlestick close below the $0.203 support level would invalidate the bullish thesis.

Radiant Capital (RDNT) price has been on a downtrend for five months. A recent spike in buying pressure has caused RDNT to rally higher.
Also read: Chainlink whales continue their accumulation spree after LINK’s 40% rally, why?
Radiant Capital price ready to move higher
Radiant Capital price has produced three distinctive lower lows and two lower lows. Connecting these swing points with trend lines reveals a falling wedge formation. A breakout from this setup could signal the start of the uptrend.
On September 28, Radiant Capital price produced a daily candlestick close above the falling wedge’s upper trend line, signaling a breakout. This move was coupled with a flip of the Relative Strength Index (RSI) and Awesome Oscillator (AO) above their respective mean levels.
The last time AO flipped positive, Radiant Capital price rallied 21% in the next 11 days. Hence, the recent uptick could catalyze a similar upswing. But despite the breakout, RDNT price needs to overcome the $0.250 hurdle. Doing so would open the path for a retest of $0.297 hurdle.
In a highly bullish case, Radiant Capital price could eye a sweep of the $0.334 level for buy-stop liquidity. This move would amount to roughly 41% gain from the current position of $0.236.
Read more: FTX exploiter moves $4 million worth of Ether after ten months of inactivity
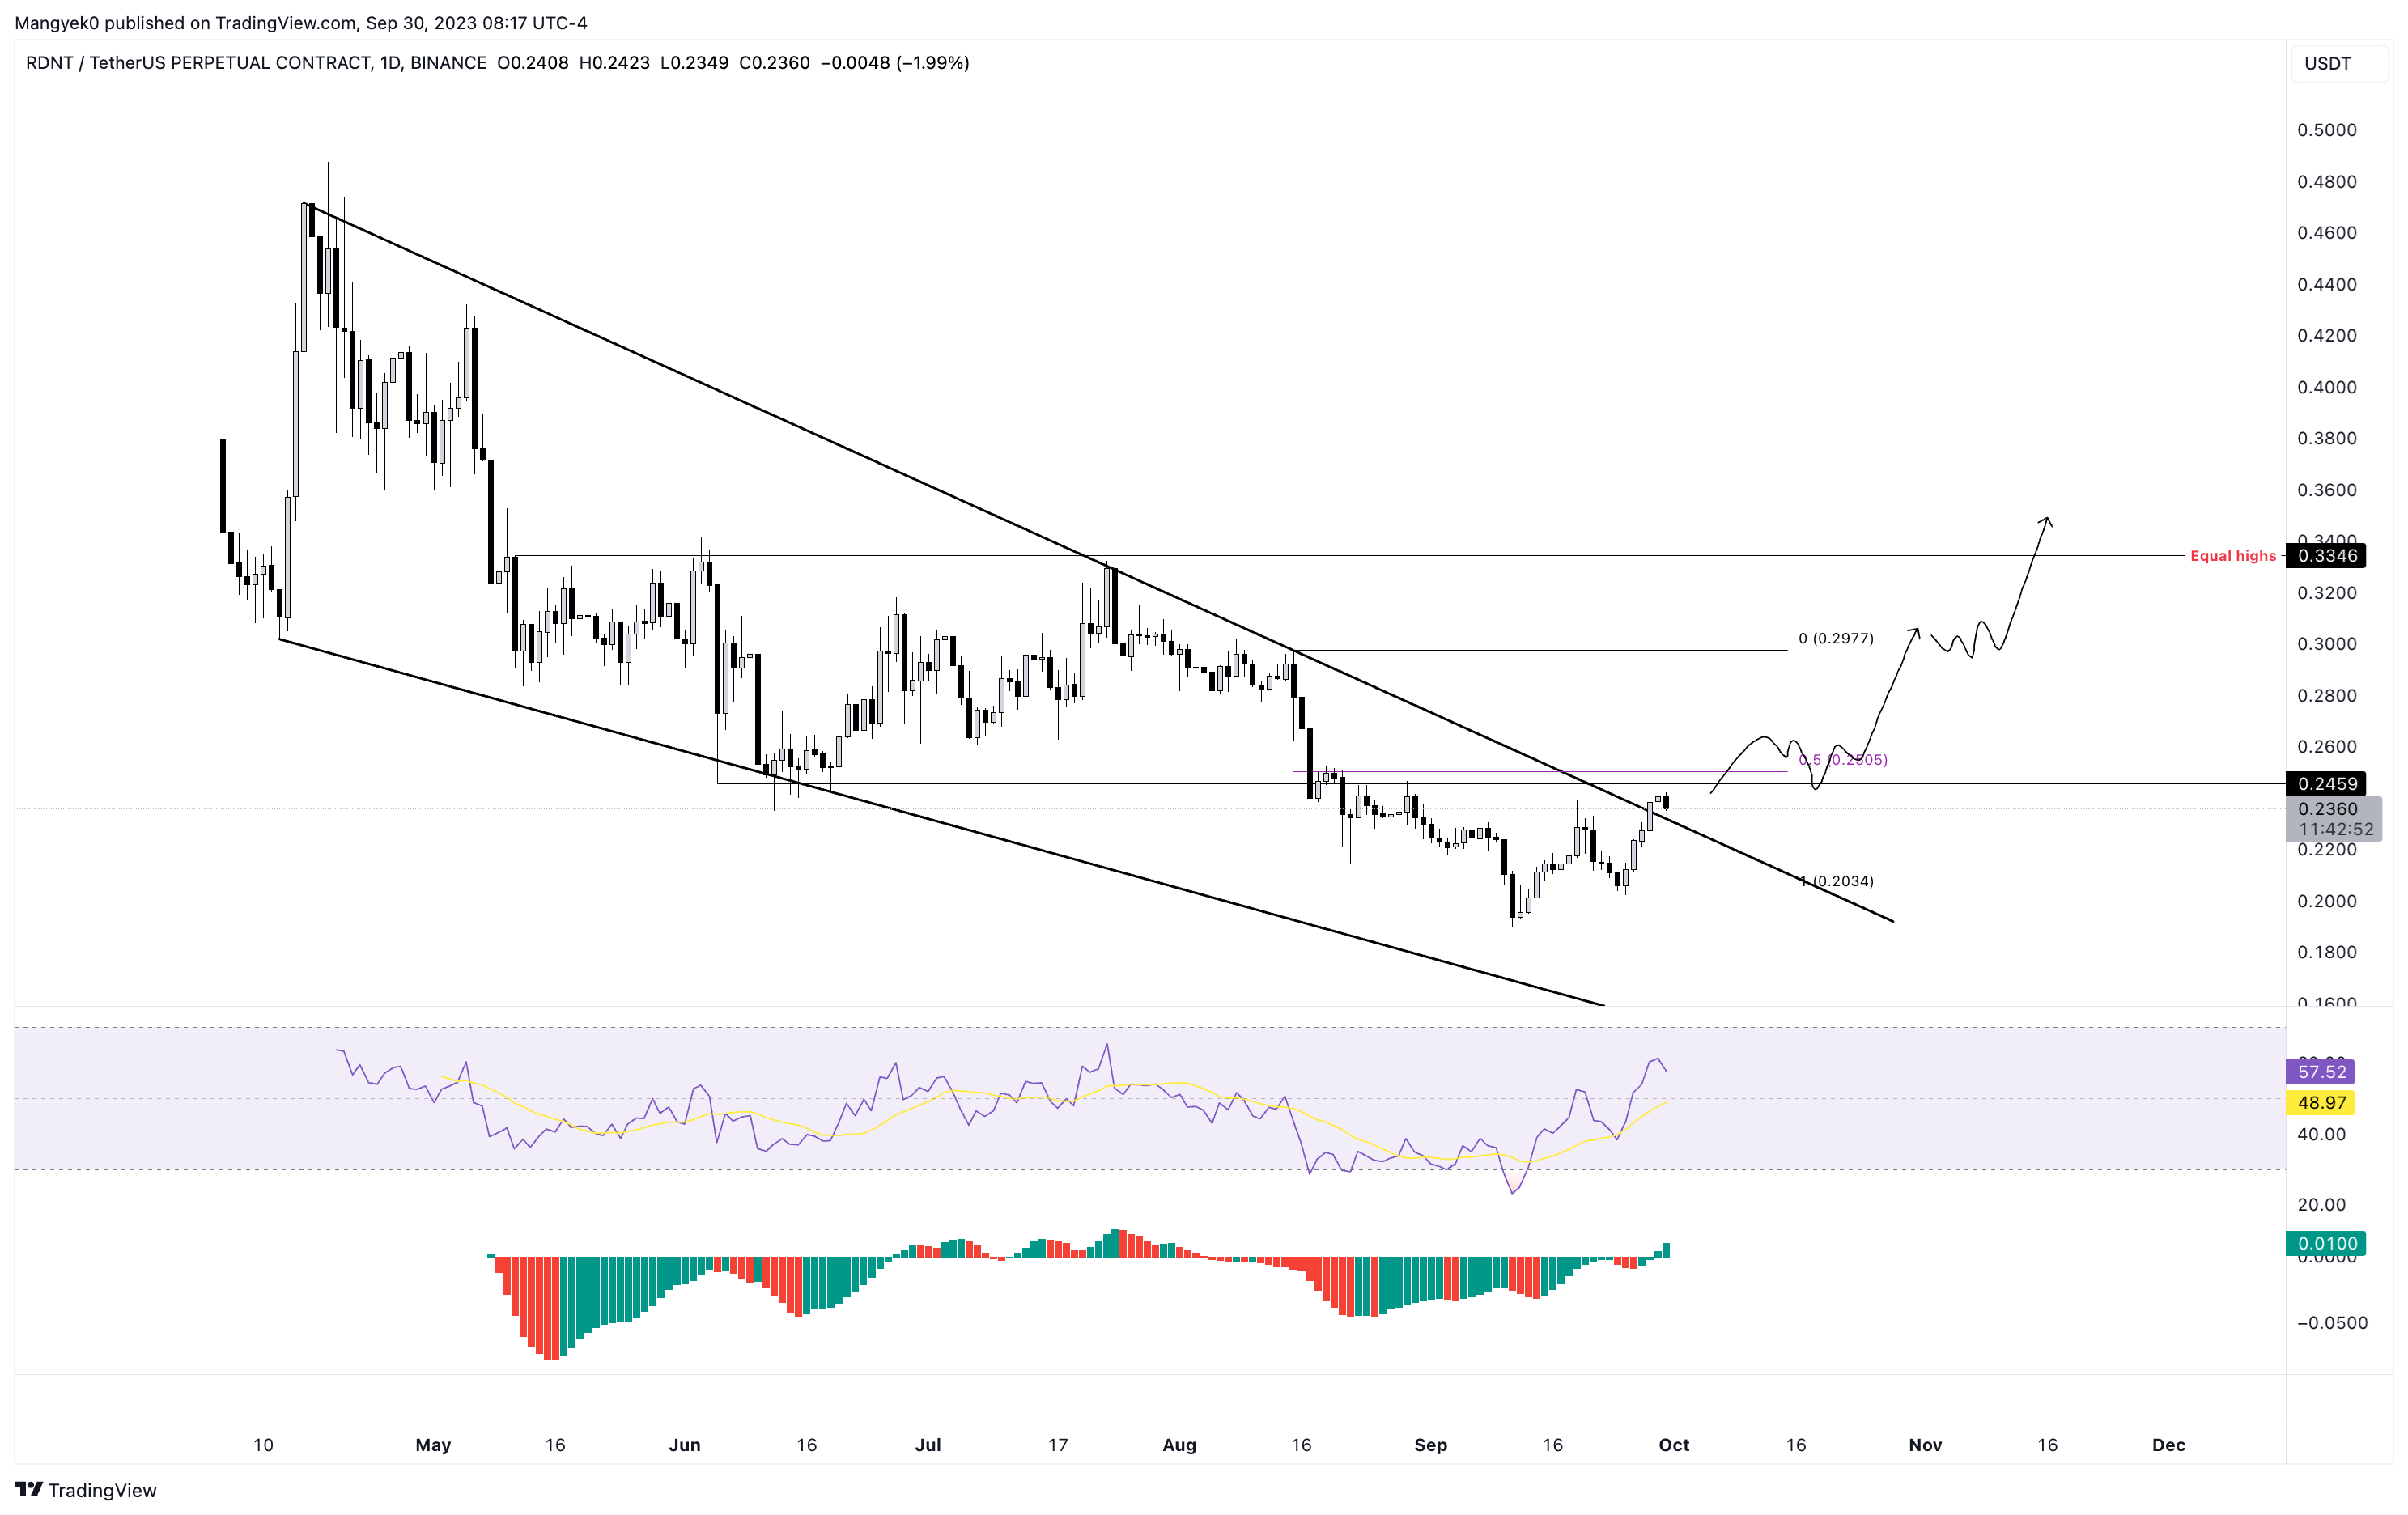
RDNT/USDT 1-day chart
On the other hand, a daily candlestick close below the $0.203 support level would create a lower low and invalidate the bullish thesis for Radiant Capital price. Such a development might even see RDNT revisit the September 11 swing low at $0.198.
Read more: Radiant price shoots up by 15% following a $10 million investment from Binance Labs
Author

Akash Girimath
FXStreet
Akash Girimath is a Mechanical Engineer interested in the chaos of the financial markets. Trying to make sense of this convoluted yet fascinating space, he switched his engineering job to become a crypto reporter and analyst.


