Solana price eyes drop to $142 as SOL correction continues
- Solana price is facing selling pressure after its rally to a new all-time high on September 9.
- The governing technical pattern suggests that SOL is expecting a plunge of 10% toward $142.
- Further selling pressure could see Solana price slide 25%.

Solana price appears to be retracing following its all-time high at $216 recorded on September 9. Although SOL defied market odds and rose to a record high while most cryptocurrencies plunged, the altcoin is correcting as its momentum has shifted to the downside.
Solana price retraces after all-time high
Solana price has dropped 25% from its swing high and could be headed for further losses as its correction ensues. On the 4-hour chart, a descending parallel channel has emerged, as SOL continues to create lower highs and lower lows.
While Solana price continues to consolidate, SOL is likely to discover meaningful support at the lower boundary of the governing technical pattern at $150. Should the altcoin slice below this level that coincides with the breakout line given by the Momentum Reversal Indicator (MRI), the bears could target lower levels.
However, substantial support will emerge at the 100 four-hour Simple Moving Average (SMA), which sits near the 61.8% Fibonacci extension level at $142. Should Solana price continue to see selling pressure, the MRI suggests that there would be another line of defense at $137.
Only a major sell-off would see Solana price tag the pessimistic target given by the prevailing chart pattern of a 25% plunge, touching the downside trend line of the lower parallel channel.
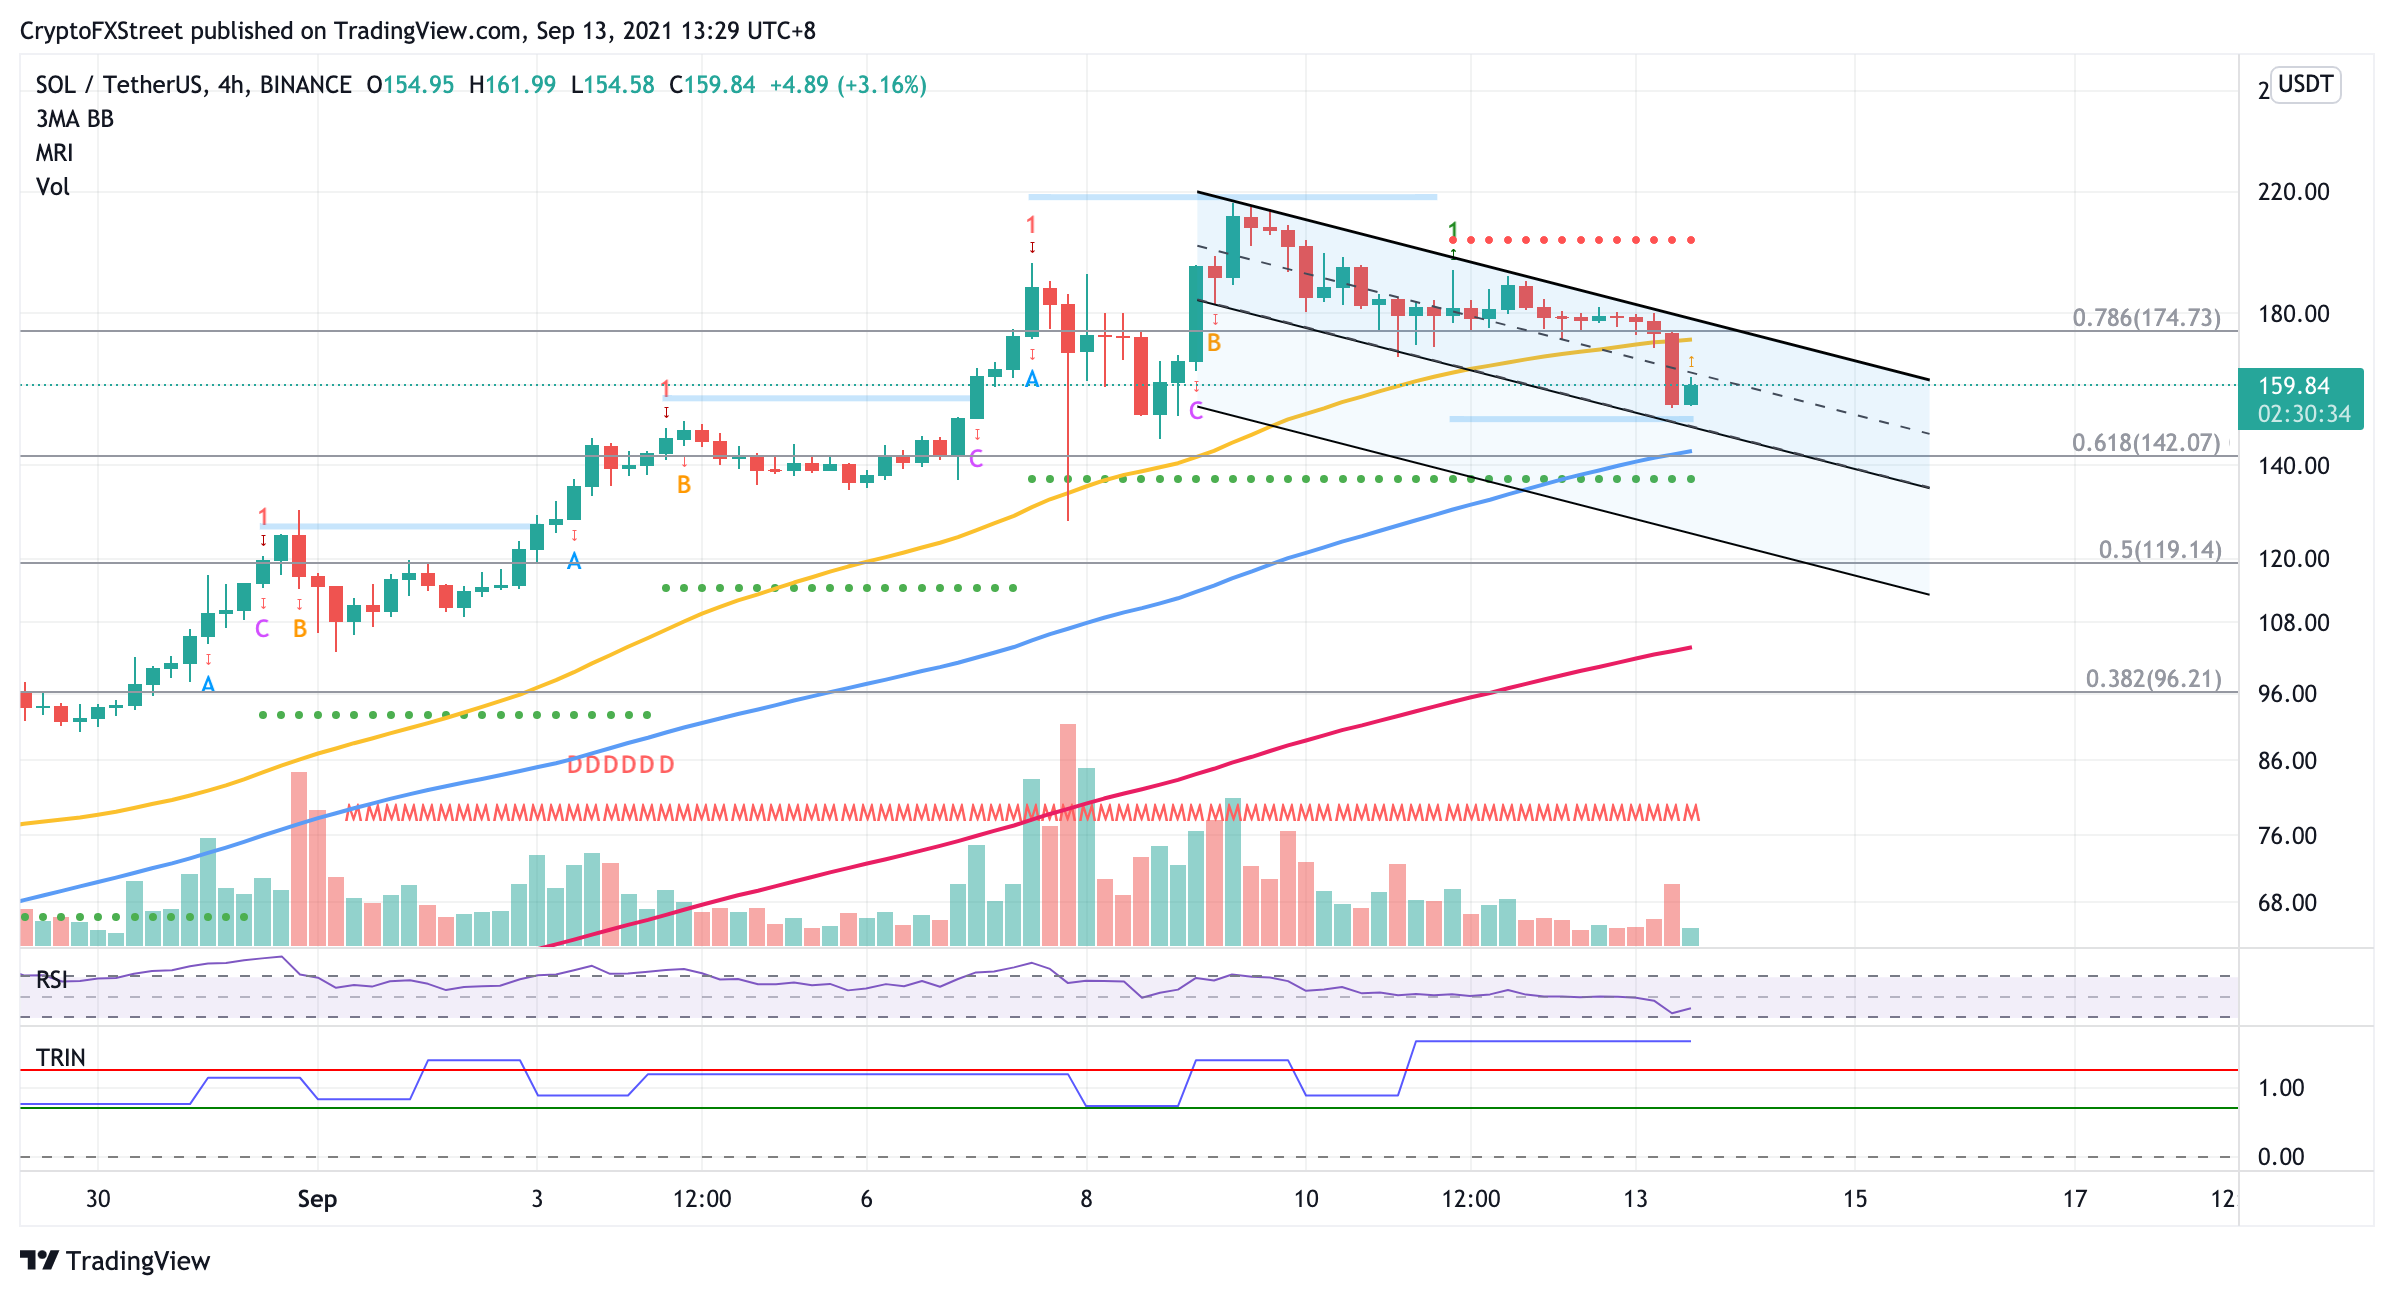
SOL/USDT 4-hour chart
Moving forward, should Solana price be able to bounce within the descending parallel channel, the likely bearish target for SOL is at $142, where the 61.8% Fibonacci extension level and lower boundary of the chart pattern eventually meet.
On the flip side, if Solana price breaks above the middle boundary of the technical pattern, this would open up the possibility of SOL tagging the next resistance level at the 50 four-hour SMA, which sits near the 78.6% Fibonacci extension level at $174. This area appears to be a substantial obstacle for the altcoin in the near term before it can attempt a new all-time high.
Author

Sarah Tran
Independent Analyst
Sarah has closely followed the growth of blockchain technology and its adoption since 2016.


