Solana eyes $300 milestone as DEX volume hits $27 billion, boosted by meme coins TRUMP and MELANIA
- Solana’s price hovers around $263 on Monday after hitting a new all-time high of $295.83 the previous day.
- SOL’s Dex trading volume reaches a new all-time high of $27 billion, boosted by meme coins TRUMP and MELANIA.
- The technical outlook and on-chain metrics hint at rally continuation as SOL’s TVL and fees generated reach record levels.

Solana (SOL) price trades in the green around $263 on Monday after hitting a new all-time high of $295.83 the previous day. Artemis data shows that SOL’s Dex trading volume reached a new all-time high of $27 billion, boosted by meme coins TRUMP and MELANIA.
The technical outlook and on-chain metrics hint at a continuation of the rally as SOL’s Total Value Locked (TVL) and fees generated reach record levels.
Solana on-chain metrics reach record levels
Solana’s price marked a new all-time high of $295.83 on Sunday, reaching a total market capitalization of $140 billion on that day, according to CoinGecko.
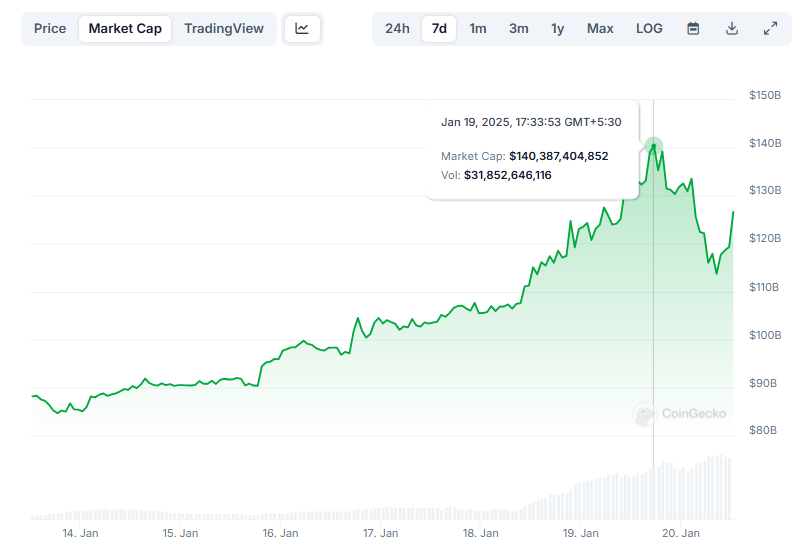
Solana Market Capitalization chart. Source: CoinGecko
This rally was mostly fueled by the rise of meme coins like TRUMP and MELANIA on the Solana blockchain last week, which attracted many retail investors and contributed to the overall bullish sentiment. Artemis Terminal data shows that SOL Chain’s decentralized exchange (DEX) trading volume rose sixfold, from $4.5 billion million on Thursday to $27 billion on Sunday, the highest volume since its launch, further bolstering the platform’s bullish outlook.
-638729582618646163.jpg)
Solana Dex trading volume. Source: Artemis Terminal.
In addition to the record volume of SOL’s Dex, crypto intelligence tracker DefiLlama data shows that Solana’s TVL increased from $10.11 billion on Monday to $14.24 billion on Sunday, the highest level since the platform’s launch.
This increase in TVL indicates growing activity and interest within the Solana ecosystem. It suggests that more users deposit or utilize assets within SOL-based protocols, adding credence to the bullish outlook.
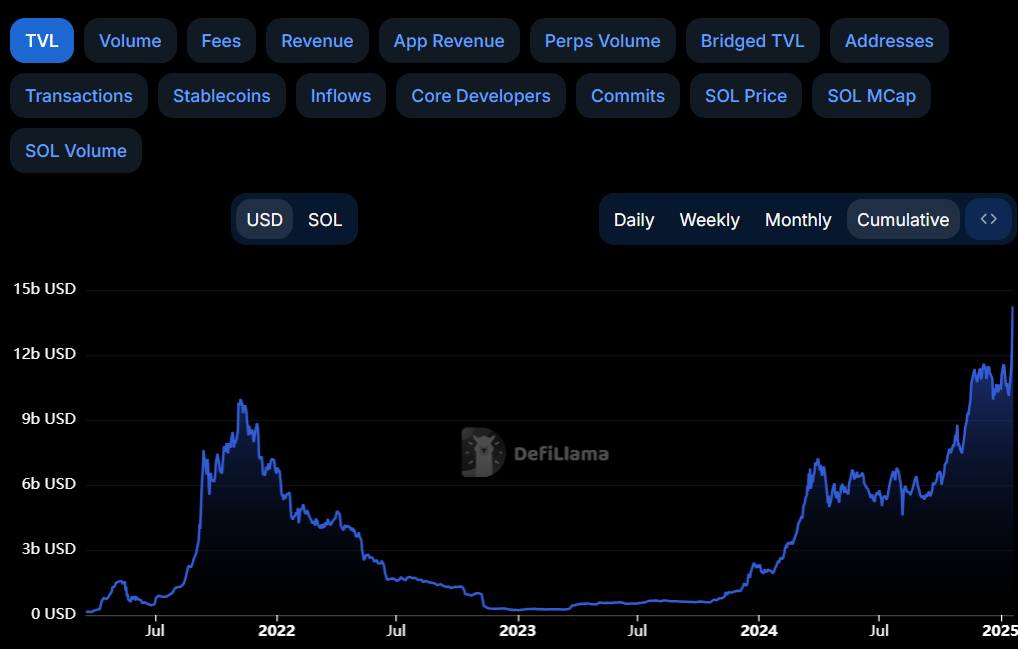
Solana TVL chart. Source: DefiLlama
Furthermore, DefiLlama data shows that SOL generated $34.27 million in fees on Monday, a new all-time high on a daily basis, further bolstering the bullish outlook.
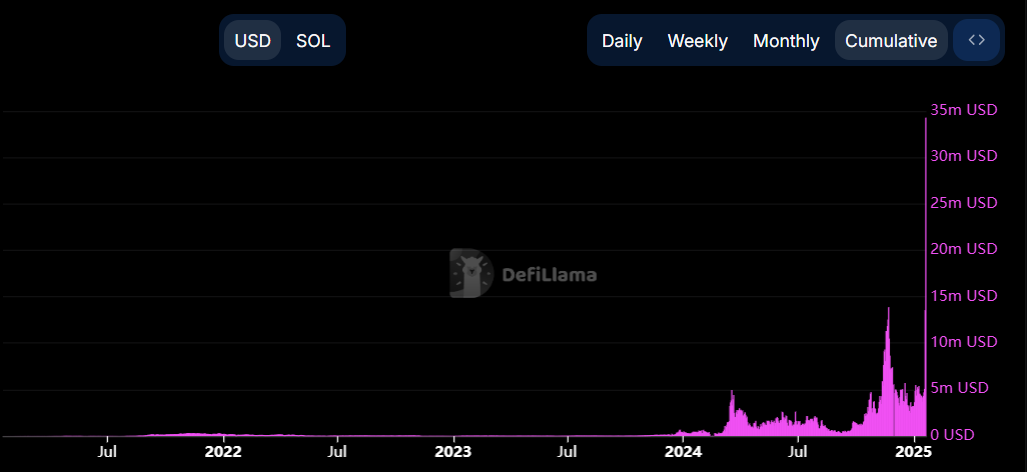
SOL daily fees generated chart. Source: DefiLlama
Solana’s technical outlook suggests a rally toward the $300 mark
Solana's price broke above a descending trendline (drawn by connecting multiple highs from the end of November) on Friday and rallied over 34% to reach a new all-time high of $295.83 on Sunday.
However, Sunday’s rise led to a sharp pullback, and SOL retested its daily support of $230. This level roughly coincides with the 50% Fibonacci retracement level (drawn from the January 13 low of $168.88 to Sunday’s high of $295.83) at $232.36, making it a key reversal zone. At the time of writing on Monday, Solana’s price rebounds, trading around $263.
If SOL continues its upward momentum, it could extend the rally to retest its Sunday all-time high of $295.83. A successful close above that level would extend an additional rally toward the psychologically important milestone of $300.
The Relative Strength Index (RSI) on the daily chart reads 69, indicating bullish momentum. However, traders should remain cautious as it reaches overbought levels and the chances of a correction or a pullback increase. Another probable scenario is that the RSI remains above overbought levels and SOL continues to rally.
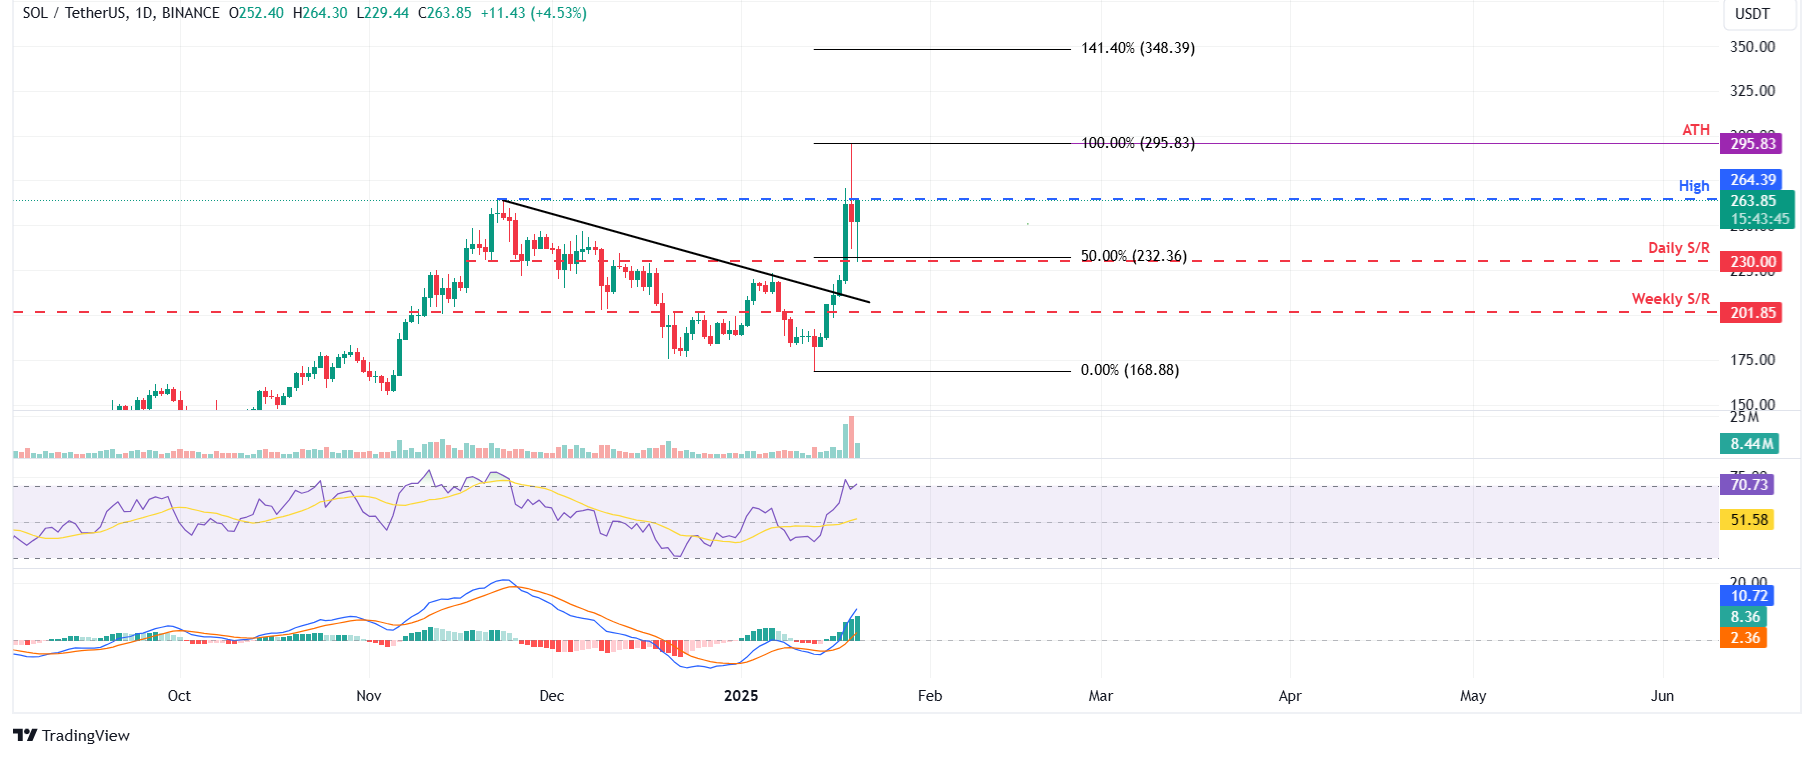
SOL/USDT daily chart
Author

Manish Chhetri
FXStreet
Manish Chhetri is a crypto specialist with over four years of experience in the cryptocurrency industry.


