- Shiba Inu price is coiling inside a descending triangle, hinting at a breakout soon.
- Investors can expect a bullish breakout leading to a 26% upswing to $0.0000150.
- A four-hour candlestick close below $0.0000106 will invalidate the bullish thesis.
Shiba Inu price continues to coil up as it trades every single day. After reaching a critical point, the momentum will collapse to one side, resulting in a breakout. Considering the market structure of Bitcoin and the recent pullback, a bullish move seems likely for SHIB.
Shiba Inu price consolidates
Shiba Inu price set up two lower highs and two equal lows since the May 12 crash. Connecting the swing points using trend lines results in a descending triangle. This technical formation forecasts a 26% move to $0.0000150, obtained by measuring the distance between the first swing high and low to the breakout point at $0.0000118.
As mentioned earlier, Bitcoin is displaying a bullish outlook, so investors can expect Shiba Inu price to follow suit. However, there could be another retest of the descending triangle’s base at $0.0000106 before the breakout occurs.
In some cases, the run-up could push Shiba Inu price to retest the $0.0000161 hurdle, bringing the total gain to 60%.
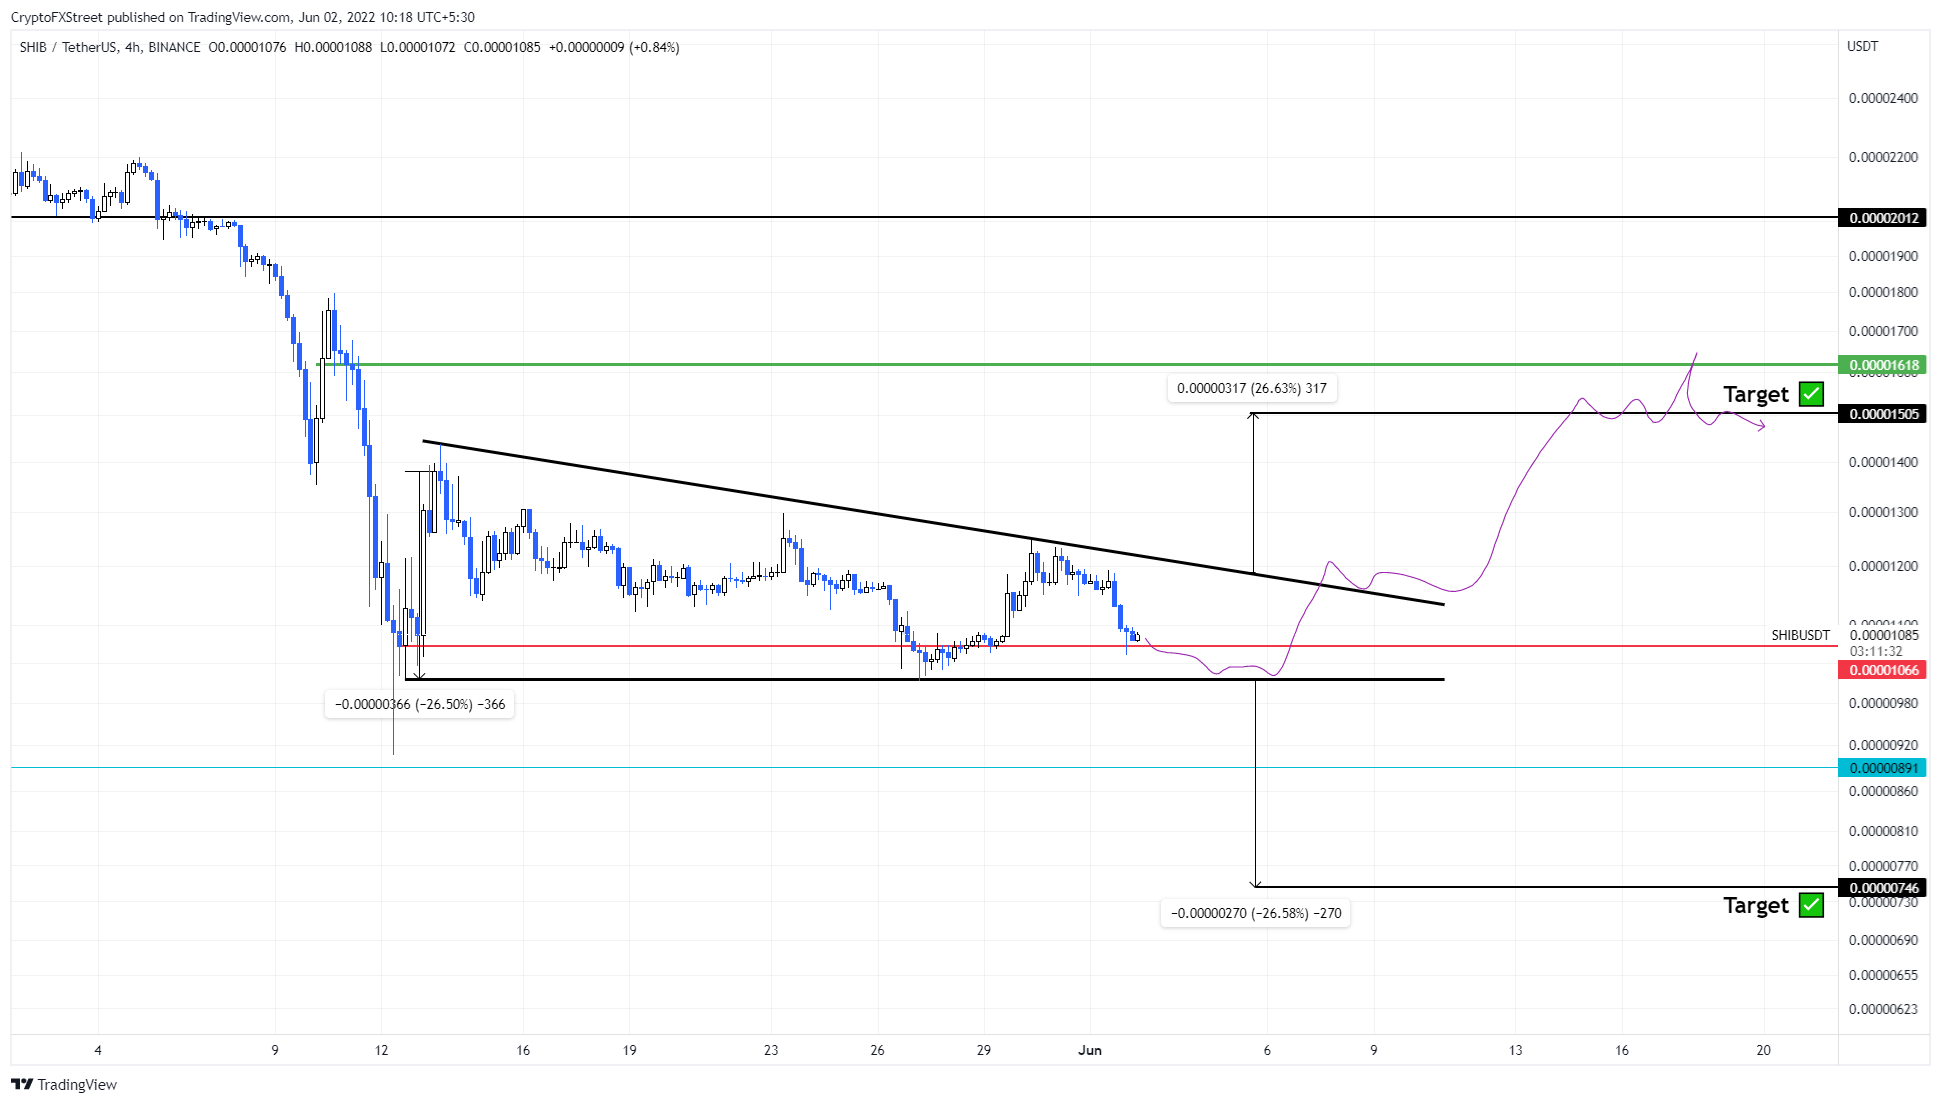
SHIB/USDT 4-hour chart
Perhaps the most important on-chain metric that aptly reveals the bullish outlook for Shiba Inu price is the 30-day Market Value to Realized Value (MVRV)
This on-chain metric is used to determine the average profit/loss of investors that purchased SHIB over the past month. Based on Santiment’s research, a value below -10% to -15% indicates that short-term holders are at a loss and are less likely to sell.
More often than not, this is where long-term holders accumulate. Hence, any move below -10% is termed an “opportunity zone.”
For SHIB, the 30-day MVRV slipped below the last two local bottoms at -34% and set a low at -44% on My 13. However, investors seem to be accumulating as seen in the recent uptick to -13%.
Interestingly, if this trend continues, the MVRV could form a local top of around 15% or 30%, suggesting that there is more room for Shiba Inu price to move higher as long-term holders continue to accumulate.
 [09.20.12, 02 Jun, 2022]-637897420947500894.png)
SHIB MVRV 30-day chart
While things are looking up for Shiba Inu price, a four-hour candlestick close below $0.0000106 will trigger a bearish breakout and invalidate the bullish thesis. This move will likely trigger a 26% crash to $0.0000074.
Information on these pages contains forward-looking statements that involve risks and uncertainties. Markets and instruments profiled on this page are for informational purposes only and should not in any way come across as a recommendation to buy or sell in these assets. You should do your own thorough research before making any investment decisions. FXStreet does not in any way guarantee that this information is free from mistakes, errors, or material misstatements. It also does not guarantee that this information is of a timely nature. Investing in Open Markets involves a great deal of risk, including the loss of all or a portion of your investment, as well as emotional distress. All risks, losses and costs associated with investing, including total loss of principal, are your responsibility. The views and opinions expressed in this article are those of the authors and do not necessarily reflect the official policy or position of FXStreet nor its advertisers. The author will not be held responsible for information that is found at the end of links posted on this page.
If not otherwise explicitly mentioned in the body of the article, at the time of writing, the author has no position in any stock mentioned in this article and no business relationship with any company mentioned. The author has not received compensation for writing this article, other than from FXStreet.
FXStreet and the author do not provide personalized recommendations. The author makes no representations as to the accuracy, completeness, or suitability of this information. FXStreet and the author will not be liable for any errors, omissions or any losses, injuries or damages arising from this information and its display or use. Errors and omissions excepted.
The author and FXStreet are not registered investment advisors and nothing in this article is intended to be investment advice.
Recommended Content
Editors’ Picks
Crypto traders brace for short-term volatility with $2.4 billion options expiry on Friday

Bitcoin and Ethereum options market looks bullish on Friday, according to data from intelligence tracker Greeks.live. The firm said it has identified two Bitcoin calls that show an underlying bullish sentiment among market participants.
XRP recovers from week-long decline following Ripple’s response to SEC motion

Ripple filed a letter to the court to support its April 22 motion to strike new expert materials. The legal clash concerns whether SEC accountant Andrea Fox's testimony should be treated as a summary or expert witness.
Lido adds 4% gains as protocol rolls out first step towards decentralization
Lido takes the first batch of simple DVT validators to live, a step taken to decentralize the protocol. Lido leveraged technology to expand the protocol to multiple node operators, inviting both solo and community stakers.
Bitcoin Weekly Forecast: Should you buy BTC here? Premium

Bitcoin (BTC) price shows signs of a potential reversal but lacks confirmation, which has divided the investor community into two – those who are buying the dips and those who are expecting a further correction.
Bitcoin: Should you buy BTC here? Premium
Bitcoin (BTC) price shows signs of a potential reversal but lacks confirmation, which has divided the investor community into two – those who are buying the dips and those who are expecting a further correction.