Shiba Inu price reveals bearish triangle as hope for new all-time high fades
- Shiba Inu price is forming a bearish triangle with bulls fleeing the scene.
- SHIB price action saw a lot of profit-taking, and even the short-term corrections could not avoid keeping the RSI in oversold territory.
- Expect a break lower as more bulls will start to cut their long positions, and Shiba Inu price could retrace to $0.00001951.
Shiba Inu (SHIB) price saw bulls making another attempt to reach new all-time highs on October 11. With a false break at $0.00003155, however, more bears came in to match the profit-taking. The Relative Strength Index (RSI) stayed in oversold territory the whole time, even during some corrections, which blocked hesitant buyers from stepping in, thus cutting short the bull run on any new volume.
Shiba Inu price does not have enough new buy volume
Shiba Inu price has been forming a bearish triangle since October 11. That same day, bulls attempted to break higher above $0.00003155, but the next day the profit reversed and SHIB price was trading lower. The RSI has been trading too long in oversold territory, which cuts off the oxygen in the bull run.
SHIB price starts to fade as no new long positions are being built while others profit. The three solid rejections on the descending side of the triangle show that the bearish triangle will play out in favor of the bears. Bears are defending this trend line, and price gets squeezed to the downside.
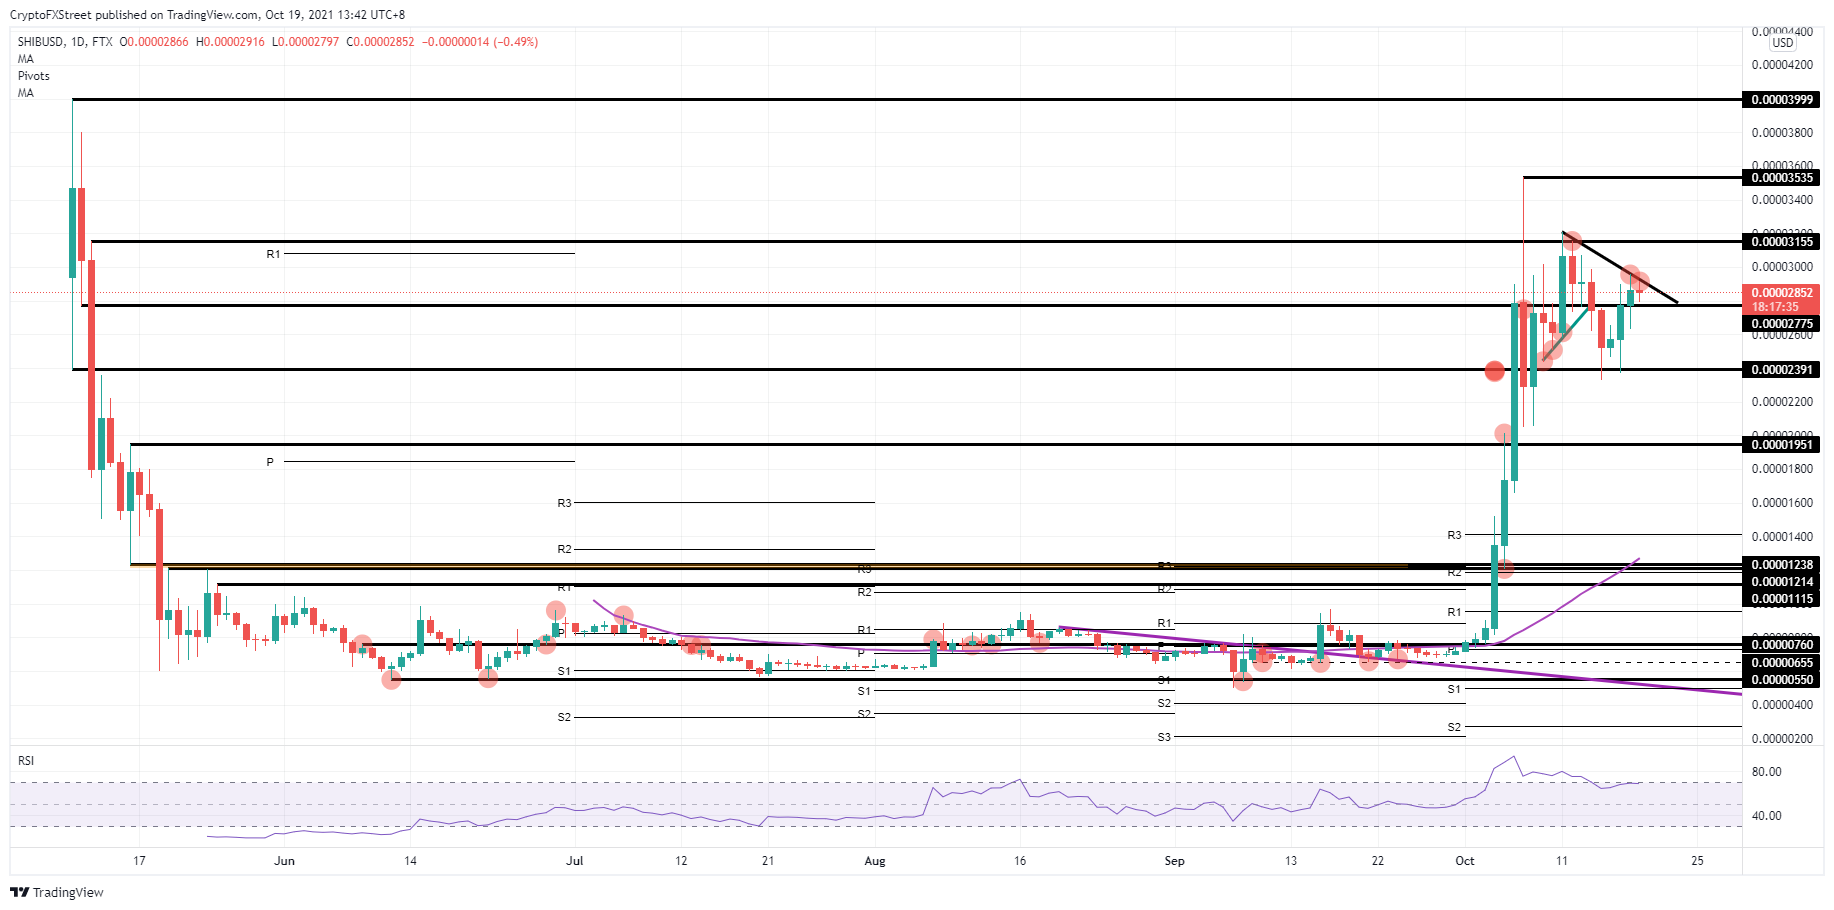
SHIB/USD daily chart
Shiba Inu price will first break $0.00002775 to the downside and could target $0.00002391. That last level had held already a few times last week. With the mounting pressure from bears and more and more bulls fleeing the scene as this rally starts to retrace, expect a dip further toward $0.00001951 and probably even $0.00001247 as a complete retracement.
Should market sentiment shift in favor of cryptocurrencies and bulls with enough incentive to add positions, expect a break of the descending line in the triangle and a retest toward $0.00003155. Should more positive tailwinds emerge, expect a retest and break of $0.00003535.
Author

Filip Lagaart
FXStreet
Filip Lagaart is a former sales/trader with over 15 years of financial markets expertise under its belt.


