Dogecoin vs. Shiba Inu: SHIB price to overthrow DOGE and rally 40%
- Dogecoin price has outperformed the Shiba Inu price by 172% since August.
- DOGE rose by 52% during the final days of November, while Shiba Inu price lost 17% of its market value.
- A pullback on the DOGE/SHIB chart would likely result in a Shiba Inu rally.
Dogecoin price has been outperforming the Shiba Inu price, but circumstances are subject to change. If market conditions persist, SHIB could gain market control and rally while DOGE heads for lower targets.
Dogecoin price outperformed Shiba Inu
Dogecoin price pulled off an astonishing uptrend rally during the fall, replenishing 180% of lost market value to the hands of investors. Shina Inu's price, on the contrary, remained stagnant. November's auction settled with a 25% decline for SHIB investors. While there is no doubt that DOGE has been the better asset to hold. Now On December 7, utilizing the help of comparative technical analysis tools, the tables may be due for a turn for the two notorious meme coins. Shiba Inu price may become the outperformer in the weeks to come.
Using Tradingview.com, investors can determine which asset will perform another by implementing a simple division equation between both assets. In this case, the Dogecoin price divided by the Shiba Inu price shows Dogecoin as a clear outperformer between the two assets. Since August 2022, DOGE has outperformed SHIB by 172%. Furthermore, investors can check the efficacy of the equation by reviewing each asset individually. Since August, DOGE has risen by 163%, while DHIB only saw a 50% uptrend spike within the same time period.
Using Elliott Wave Theory, a clear five-wave impulse is shown on the DOGE/SHIB chart. The technicals also bounced from the 38.2% Fiib level on November 10, and printed a double top formation on November 31. The Fibonacci retracement level is extracted from measuring the swing low in August to the recent swing high in November. The rally shown was a result of DOGE's last-minute 52% recovery rally between November 14 through November 31. The Shiba Inu price lost 17% of its market value during this same time period.
If the DOGE/SHIB chart has indeed topped, a decline into the lower targets could result inversely as a Shiba Inu rally. In other words, a plummet into the "Golden Pocket" 61.8% Fibonacci Retracement level would result in a 40% increase for the Shiba Inu price. It is worth noting that the DOGE price could also decline by 80% while Shib remained entirely still to manifest the aforementioned scenario's outcome on the DOGE/SHIB chart. Due to both assets' correlation with Bitcoin, the primary scenario is the more likely outcome.
The Relative Strength Index supports the idea that Shiba Inu will soon outperform the Dogecoin price as a divergence between wave three and wave five is shown on the daily chart. The divergence signal may be the catalyst for the pullback to induce the rotational powershift investors are looking for.
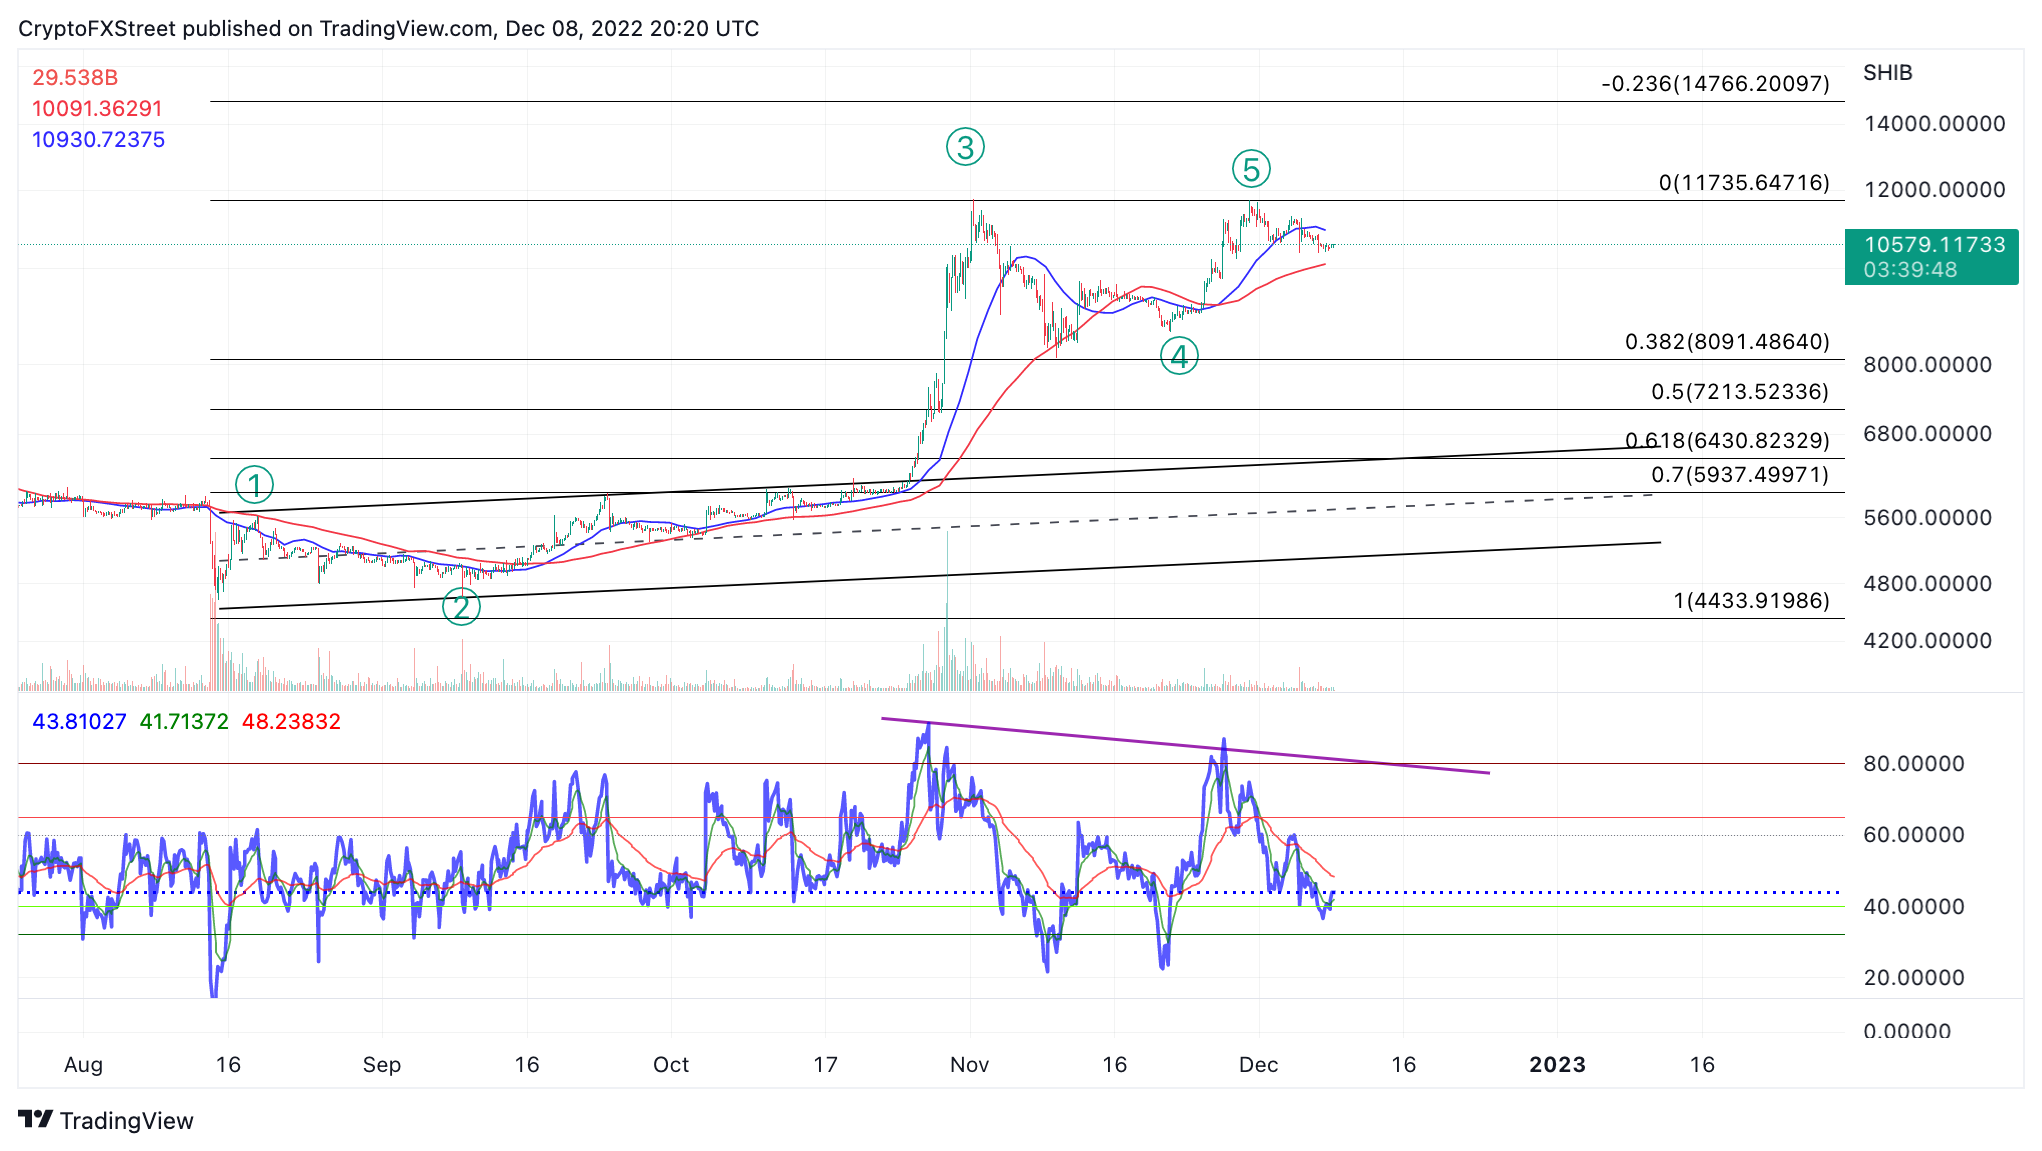
DOGE/USDT/SHIB/USDT 1-Day Chart
To recap, Investors may want to keep their eyes on the DOGE/SHIB chart to gauge the strength of both dog coins going into 2023. Doge's outperformance of SHIB has gone on for nearly half a year, and a rotational shift would be more than reasonable. Traders may be able to use classical technical analysis techniques on the DOGE/SHIB chart in anticipation of a profitable opportunity.
Author

Tony M.
FXStreet Contributor
Tony Montpeirous began investing in cryptocurrencies in 2017. His trading style incorporates Elliot Wave, Auction Market Theory, Fibonacci and price action as the cornerstone of his technical analysis.


