Shiba Inu Price Prediction: SHIB’s recovery stifled as trading volume plunges to $173M
- Shiba Inu price starts to erase its 24-hour gains after running into selling pressure at the 50-day EMA.
- SHIB remains fundamentally weak to rally amid a persistent drop in active addresses.
- Buyers will likely arrest Shiba Inu’s losses at $0.00000880 and pave the way for a significant recovery to $0.00001024.
Shiba Inu (SHIB) price has suddenly snapped out of a bullish mid-week stint which experts believe came from extremely oversold market conditions. The second-largest meme coin printed several green candles before tapping out at $0.00000911. Bears will likely push SHIB down to its primary support at $0.00000830 if declines are not arrested on time.
Shiba Inu price analysis as trading volume drops to $173M
Shiba Inu price is recording a 16.73% drop in trading volume across all cryptocurrency exchanges despite its mid-week rebound. According to CoinMarketCap, $173 million was traded in 24 hours. This downtrend in volume had persisted since November 10, when the $625 million was traded.
The slow trend could be a product of decreased network activity, as highlighted by the Daily Active Addresses on-chain metric from Santiment. Only 3,572 addresses have interacted with SHIB on the protocol compared to a 30-day peak of 14,363, recorded on November 13.
 [17.41.26, 23 Nov, 2022]-638048168060011946.png)
Shiba Inu Daily Active Addresses
The FTX crisis continues to keep investors and traders away from crypto markets. A consistent southbound trend in the number of daily addresses actively transacting on the blockchain provides a sneak peek into the level of speculation among investors. Therefore, Shiba Inu price could only recover if retail investors make a strong comeback.
Bears snuff out SHIB’s bullish spark
Shiba Inu price did not manage to break and hold above the resistance provided by the 50-day Exponential Moving Average (EMA) (in red) at $0.00000902, possibly due to early profit booking by investors who are too anxious to wait, thanks to the FTX contagion.
SHIB trades at $0.00000892 while looking forward to resting on relatively higher support. The falling trend line is the first support candidate at $0.00000880, but declines could stretch to the primary support at $0.00000830.
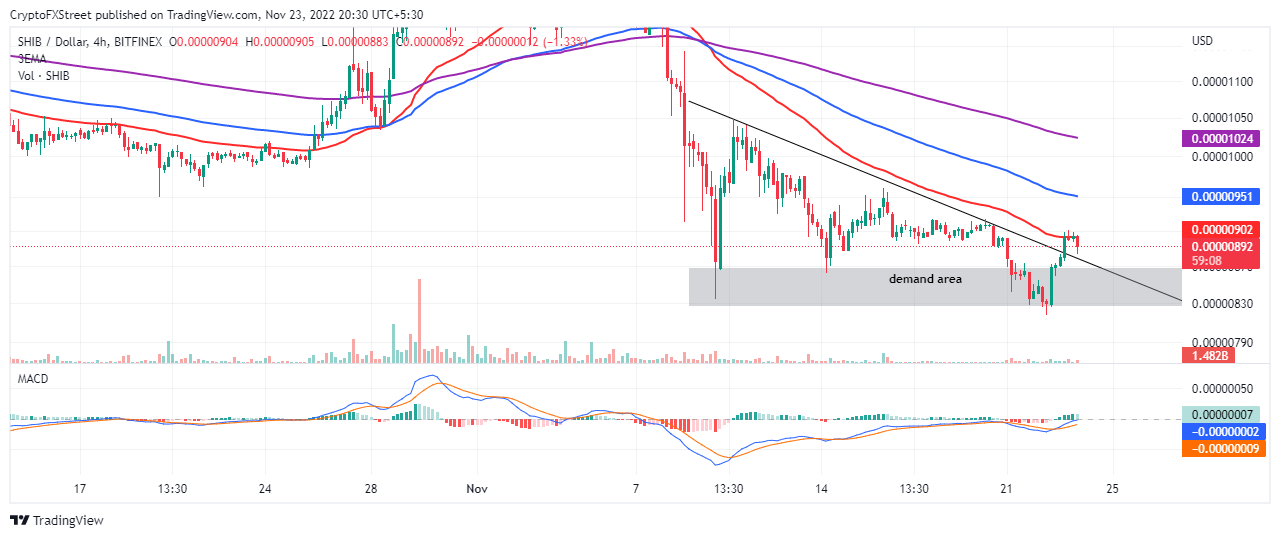
SHIB/USD four-hour chart
At the moment Shiba Inu price lacks enough momentum to change the outlook from bearish to bullish, hence, buyers should pay attention to a buy signal from the Moving Average Convergence Divergence (MACD) indicator.
Buy orders can be triggered above the 50-day EMA using the MACD’s movement above the mean line (0.00) into the positive territory as a confirmation signal. Profit booking can potentially occur at the 100-day EMA (in blue) around $0.00000951 and the 200-day EMA (in purple), holding the ground at $0.00001024.
Author

John Isige
FXStreet
John Isige is a seasoned cryptocurrency journalist and markets analyst committed to delivering high-quality, actionable insights tailored to traders, investors, and crypto enthusiasts. He enjoys deep dives into emerging Web3 tren


