Shiba Inu Price Prediction: Another 1x rally in sight after the pullback?
- Shiba Inu price experienced a 10% drop last week.
- SHIB shows potential for a 100% rally, targeting $0.00003100 if the bullish trend continues.
- Confirmation of the uptrend will arrive with a break above $0.0001575.

Shiba Inu price shows the potential to endure the short-term downtrend and become a much higher-valued crypto asset in the coming weeks. Traders should continue to watch the notorious meme coin for a potential move.
Shiba Inu price is worth keeping an eye on
Shiba Inu exhibits bullish cues as it hovers above a previous resistance zone at $0.0001200. Last week SHIB witnessed a 10% decline in market value, which was the most decisive red week of 2023. Despite the bearish influx, the uptrend, which began on January 1st and prompted a 1x rally into the year-to-date high at $0.00001575, remains intact.
Shiba Inu price is currently trading at $0.00001266, between the 8-day exponential moving average and 21-day simple moving average. The consolidation displayed is a common preparation signal for traders, as volatile moves often occur in both directions from the point where the indicators meet.
The Relative Strength Index (RSI), an indicator used to gauge momentum, suggests that the digital meme coin is entering supportive levels after reaching overbought territory. The RSI indicates that the 100% rally earlier this winter may only be half of the potential move up. Thus SHIB may be preparing for another 100% rally from the year-to-date high, targeting the $0.00003100 liquidity zone.
It's important to note that the RSI must maintain its level above 40 to sustain a bullish uptrend potential. Currently, the RSI is hovering at 50. If the move from the consolidation is to the downside, there could be a 30% downswing toward the $0.0000976 congestion area before buyers step back into the market.
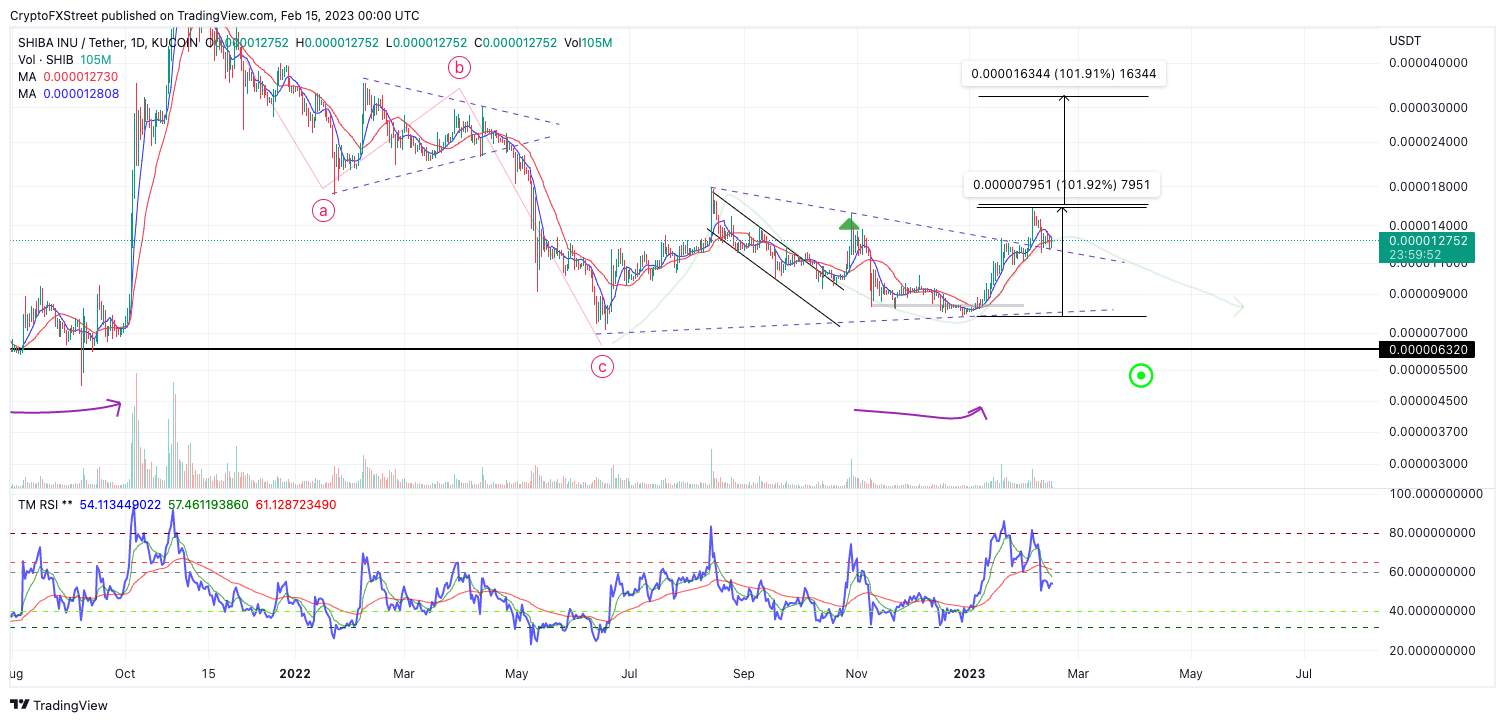
SHIB/USDT 1-Day Chart
The invalidation of the short-term bearish trend will occur if there is a breach of the year-to-date high at $0.0001575. This could signal the start of another 100% rally in the coming weeks.
Author

Tony M.
FXStreet Contributor
Tony Montpeirous began investing in cryptocurrencies in 2017. His trading style incorporates Elliot Wave, Auction Market Theory, Fibonacci and price action as the cornerstone of his technical analysis.