Shiba Inu price free to pursue 50% rally after SHIB beats pivotal resistance
- Shiba Inu price compression leads to price expansion of 40% from the August 6 close to the August 8 high.
- SHIB is currently holding the tactically important 50-day simple moving average (SMA).
- The meme token remains locked in a descending parallel channel, despite burst higher.
Shiba Inu price paralyzation from July 22 to August 6 generated a lot of doubt and relative uncertainty. Still, SHIB broke the silence with a 23.30% gain on August 7, claiming the 50-day SMA for the first time since July 7. The development is more than a technical event and has positioned the cryptocurrency for a potentially better outcome if it can reconcile the resistance formed by the upper line of the descending parallel channel.
Shiba Inu price adds an exclamation point after patience
Shiba Inu price closed last week with a gain of 15.53%, marking the best weekly return since the beginning of May and removing SHIB from the threat of a new correction low that had dominated since July 22.
A big result of the Shiba Inu price action from July 22 to August 6 was the compression of the Bollinger Bands to a very tight range that often precedes a significant move, and that was the case this time. Importantly, it had been projected by previous FXStreet posts on SHIB.
The close above the 50-day SMA on August 7 triggered the buy signal for Shiba Inu price and the bullish narrative. It has opened up new possibilities for SHIB, including the breakout from the upper line of the descending parallel channel, now at $0.00000794, a test of the June 29 high of $0.00000962 and a march to the May 24 and May 20 highs at $0.00001214 and $0.00001204, respectively.
A Shiba Inu price rally to $0.00001214 would reward SHIB investors with a 56.00% gain from August 7 close above the 50-day SMA.
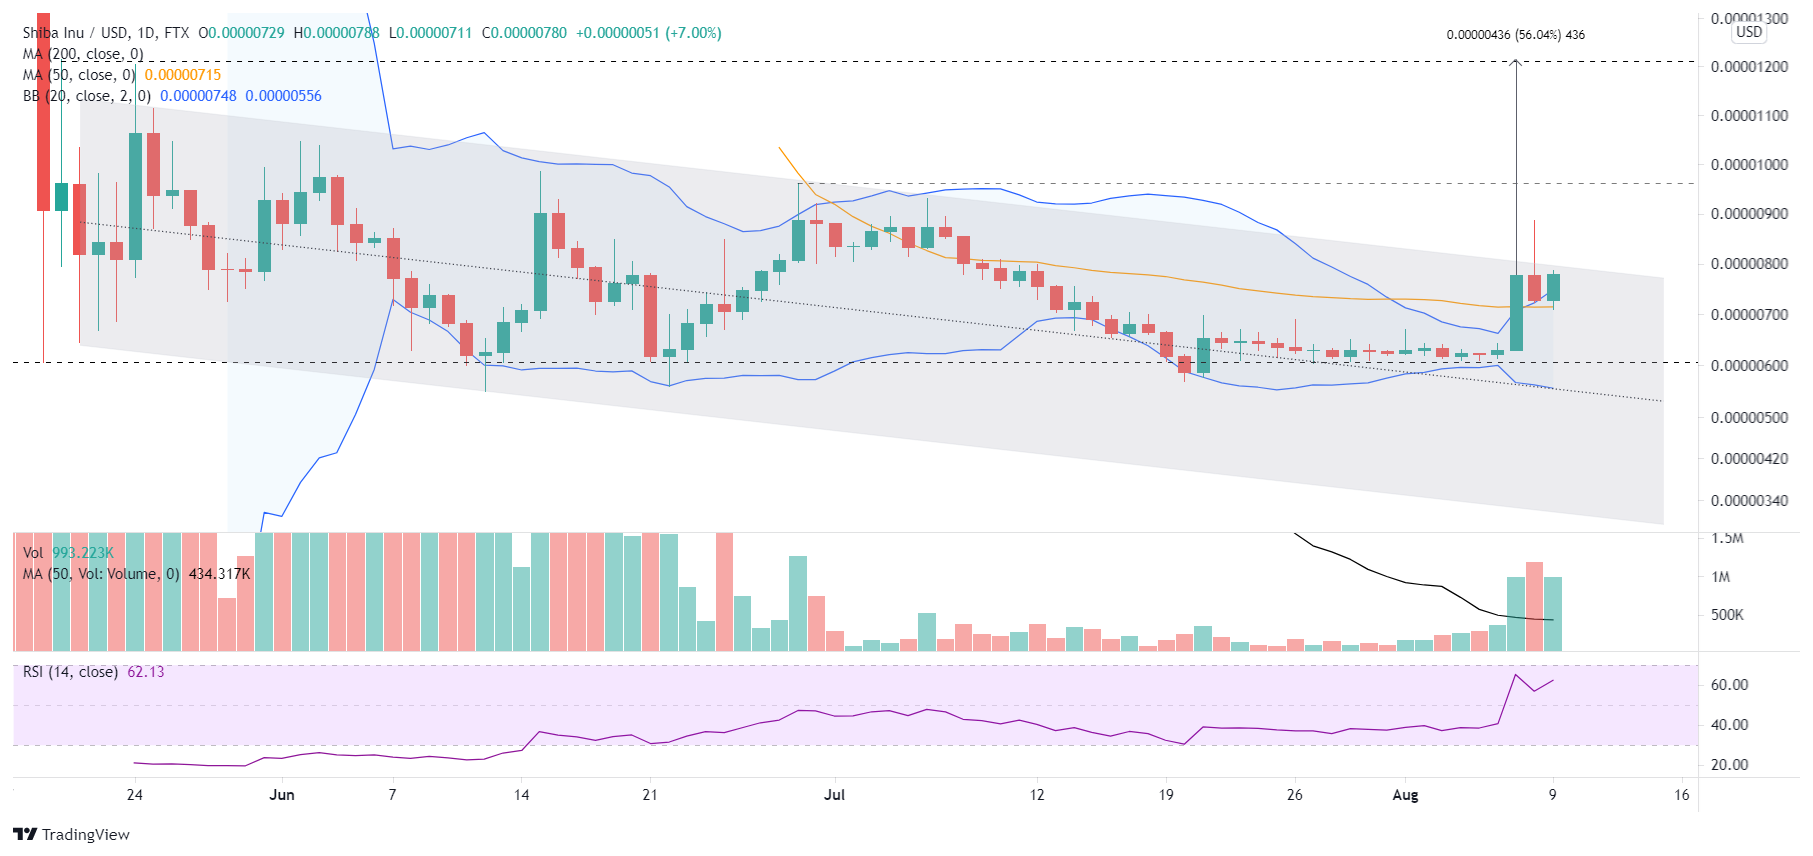
SHIB/USD daily chart
The SHIB forecast for new frontiers on the upside would be disrupted by a daily close below the 50-day SMA at $0.00000715. It would introduce the probability of a test of the May 19 low of $0.00000607, a level that guided Shiba Inu price from July 22 to August 6.
A SHIB daily close below the May 19 low assigns attention to the midline of the descending parallel channel at $0.00000556 and then the June 12 low of $0.00000550. Any further weakness targets the channel’s lower line, now at $0.00000317.
Shiba Inu price was not actionable below the 50-day SMA. It was necessary to confirm interest in the cryptocurrency, which occurred over the weekend, rewarding patient market operators. Now SHIB investors can pursue the upside with the potential of reaching new bullish frontiers.
Here, FXStreet's analysts evaluate where SHIB could be heading next as it looks primed for a 70% rally.
Author

Sheldon McIntyre, CMT
Independent Analyst
Sheldon has 24 years of investment experience holding various positions in companies based in the United States and Chile. His core competencies include BRIC and G-10 equity markets, swing and position trading and technical analysis.


