Shiba Inu Price Forecast: SHIB investor patience may reward 40% profit
- Shiba Inu price releases from a cup completion cheat base on the four-hour chart, but the advance is short-lived.
- 50 four-hour simple moving average (SMA) has turned higher, adding credible support to balance any volatility.
- SHIB prone to quick bursts with no follow-through, challenging bullish investor conviction.
Shiba Inu price sketched out a cup completion cheat base from May 24 to June 2 with a pivot of $0.00000995, triggering yesterday. It was a short, four-hour burst that has since settled below the pivot. The minor new uptrend and a rising 50 four-hour SMA improve the probabilities that SHIB will reach pertinent price targets moving forward.
Shiba Inu price fades keep investors honest
From May 19 until May 24, Shiba Inu price formed a symmetrical triangle pattern with two reaction highs and three reaction lows with a measured move target of $0.00001450, representing a 50% gain. During the development of the triangle, SHIB closed with consecutive inside days.
On May 24, Shiba Inu price executed an impulsive breakout from the symmetrical triangle pattern, generating a 30% gain. Still, SHIB failed to capitalize and quickly fell into a downward drift, highlighted by resistance at the 10-day SMA and support at the triangle’s upper trend line.
During the May 28-30 period, Shiba Inu price balanced along the apex level of the symmetrical triangle, registering another inside day on May 30, leading to an eight-hour price burst that was quickly faded.
It has been notable that since the May 21 low, most of the price progress has been contained to four-hour bursts that are partially faded. The SHIB price action has kept investors honest with their trading tactics and forced a heightened level of patience.
Yesterday, Shiba Inu price released from a cup completion cheat pattern with a double-digit gain, but it failed to stick above the pivot. A cup completion cheat occurs when a handle-like consolidation forms in the lower half or even the lower third of an emerging cup. It offers an early entry point, and it is optimal to initiate with a pilot buy.
The measured move target of the base is $0.00001363, representing a 37% gain from the high of the cheat area. The target is calculated by taking the distance from the base low to the cheat area high and adding it to the cheat area high.
To reach the stated target, Shiba Inu price will struggle with a price range defined by the May 24 high at $0.00001204, the May 20 high at $0.00001214 and the May 16 low at $0.00001238, yielding a 20% return from the cheat pivot.
The only other relevant resistance is the 23.6% Fibonacci level of the May correction at $0.00001325.
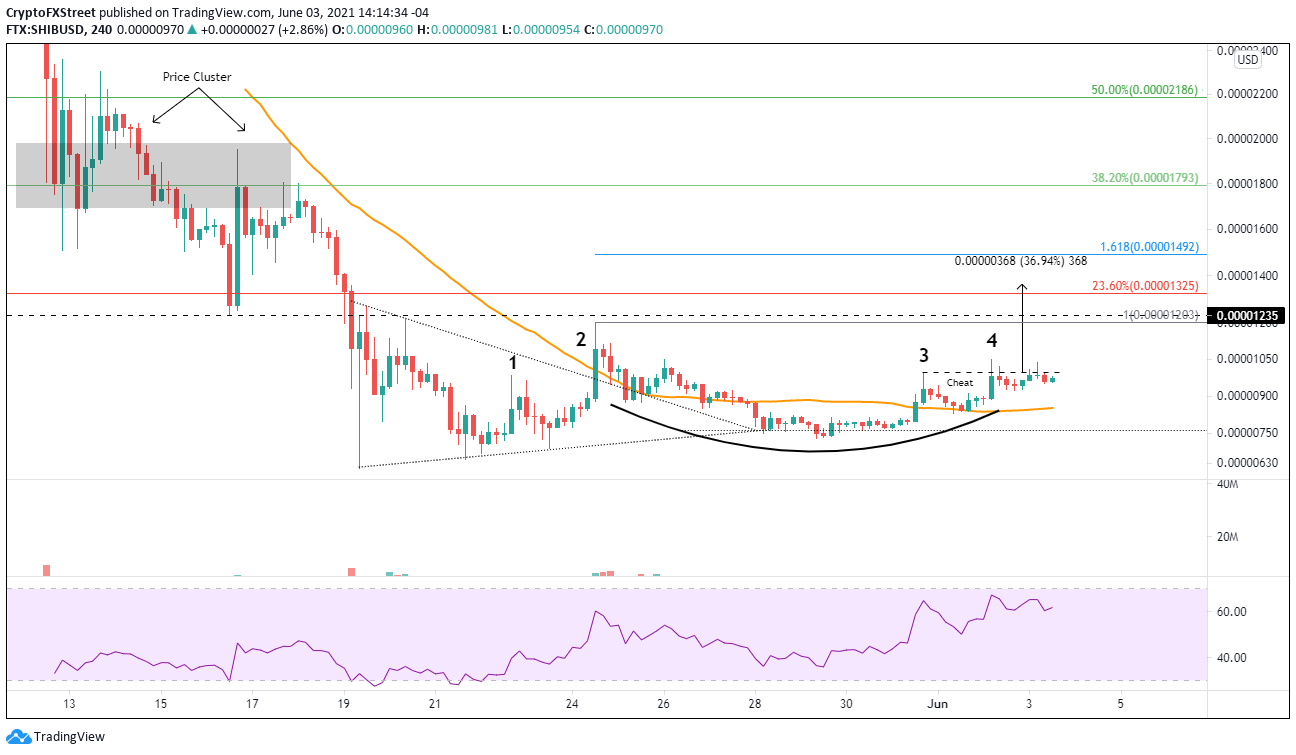
SHIB/USD 4-hour chart
SHIB support begins at the junction of the 50 four-hour SMA at $0.00000851, with the cheat area low at $0.00000830. Any further weakness should raise concern and prompt investors to trim positions or fully liquidate.
If historical precedent holds, SHIB investors should be prepared for short bursts matched with some price fade, thus requiring patience. However, the overall trend should remain tilted upwards for the foreseeable future. As a caveat, no cryptocurrency will escape the force of another heavy sell-off in the complex.
Author

Sheldon McIntyre, CMT
Independent Analyst
Sheldon has 24 years of investment experience holding various positions in companies based in the United States and Chile. His core competencies include BRIC and G-10 equity markets, swing and position trading and technical analysis.


