- Shiba Inu price shows a lack of bullish momentum that has pushed it back inside the pennant.
- The $0.0000106 to $0.0000111 demand zone is the only valid support that stands between a 34% upswing and a 22% crash.
- A daily candlestick close below $0.0000095 will trigger a nosedive to $0.0000082.
Shiba Inu price has been a relatively bad altcoin to trade. The meme coin has pushed its users from euphoria to greed in late June and indecisiveness throughout July with a tiny bit of hope as it breached a bullish continuation pattern.
Now, the so-called “Dogecoin-killer” seems to be on a path to discarding this optimistic outlook, hinting at a potentially bearish scenario.
Shiba Inu price and its last line of defense
Shiba Inu price breached a bullish pennant, aka a continuation pattern, on July 18 as it rallied 22% in under 48 hours. This technical formation is made up of a flagpole and a pennant.
For SHIB, the 34% explosive move between June 19 and June 25 created the flagpole and the consolidation that ensued in the form of higher lows and lower highs created a pennant.
This pattern forecasts a 34% upswing to $0.0000154, obtained by adding the flagpole’s height to the breakout point at $0.0000116. After a clean breakout on July 18 at $0.0000116, SHIB also provided a clean retest of the pennant, further confirming its bullish outlook.
As a result, Shiba Inu price climbed 14% after producing a breakout. However, the bearish forces took control, leading to a premature reversal of this move that has now pierced the pennant’s body.
Technically, this move already decreases the chances of a breakout reaching its destination; regardless, there is still a chance.
Since Shiba Inu price currently retests the $0.0000106 to $0.0000111 demand zone, it is the altcoin’s last hope of saving the bullish outlook. Assuming SHIB bulls step in and defend this level, the buyers will have another chance to trigger a run-up to the forecasted target at $0.0000154.
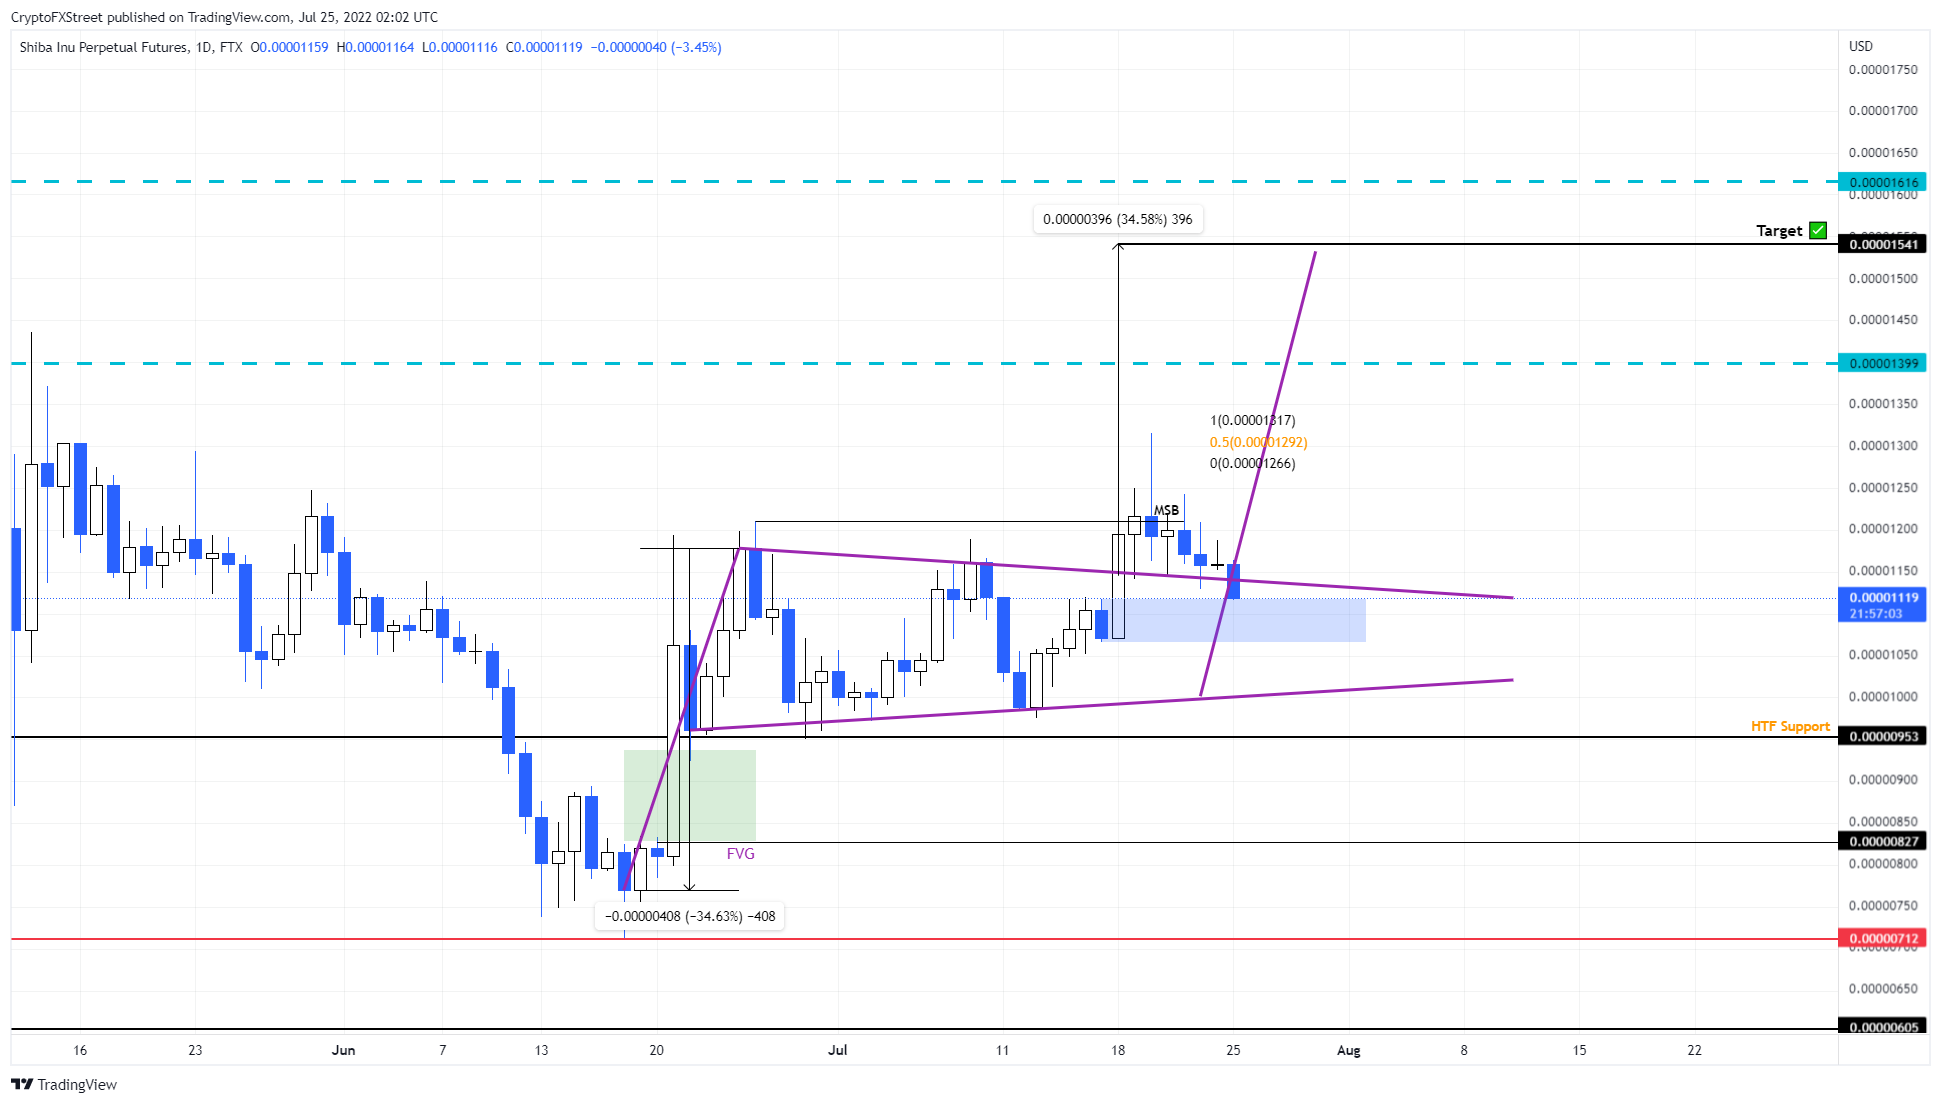
SHIB/USDT 1-day chart
On the other hand, if Shiba Inu price fails to hold above the $0.0000106 to $0.0000111 demand zone, it will indicate a weakness among buyers. In such a case, a daily candlestick close below the $0.0000106 level will invalidate the bullish thesis and trigger a move to $0.0000095.
A breakdown of this level will further trigger a 22% crash to $0.0000083.
Information on these pages contains forward-looking statements that involve risks and uncertainties. Markets and instruments profiled on this page are for informational purposes only and should not in any way come across as a recommendation to buy or sell in these assets. You should do your own thorough research before making any investment decisions. FXStreet does not in any way guarantee that this information is free from mistakes, errors, or material misstatements. It also does not guarantee that this information is of a timely nature. Investing in Open Markets involves a great deal of risk, including the loss of all or a portion of your investment, as well as emotional distress. All risks, losses and costs associated with investing, including total loss of principal, are your responsibility. The views and opinions expressed in this article are those of the authors and do not necessarily reflect the official policy or position of FXStreet nor its advertisers. The author will not be held responsible for information that is found at the end of links posted on this page.
If not otherwise explicitly mentioned in the body of the article, at the time of writing, the author has no position in any stock mentioned in this article and no business relationship with any company mentioned. The author has not received compensation for writing this article, other than from FXStreet.
FXStreet and the author do not provide personalized recommendations. The author makes no representations as to the accuracy, completeness, or suitability of this information. FXStreet and the author will not be liable for any errors, omissions or any losses, injuries or damages arising from this information and its display or use. Errors and omissions excepted.
The author and FXStreet are not registered investment advisors and nothing in this article is intended to be investment advice.
Recommended Content
Editors’ Picks
Crypto traders brace for short-term volatility with $2.4 billion options expiry on Friday

Bitcoin and Ethereum options market looks bullish on Friday, according to data from intelligence tracker Greeks.live. The firm said it has identified two Bitcoin calls that show an underlying bullish sentiment among market participants.
XRP recovers from week-long decline following Ripple’s response to SEC motion

Ripple filed a letter to the court to support its April 22 motion to strike new expert materials. The legal clash concerns whether SEC accountant Andrea Fox's testimony should be treated as a summary or expert witness.
Lido adds 4% gains as protocol rolls out first step towards decentralization
Lido takes the first batch of simple DVT validators to live, a step taken to decentralize the protocol. Lido leveraged technology to expand the protocol to multiple node operators, inviting both solo and community stakers.
Bitcoin Weekly Forecast: Should you buy BTC here? Premium

Bitcoin (BTC) price shows signs of a potential reversal but lacks confirmation, which has divided the investor community into two – those who are buying the dips and those who are expecting a further correction.
Bitcoin: Should you buy BTC here? Premium
Bitcoin (BTC) price shows signs of a potential reversal but lacks confirmation, which has divided the investor community into two – those who are buying the dips and those who are expecting a further correction.