Shiba Inu holds critical support before SHIBA rises to $0.000045
- Shiba Inu price tests critical Ichimoku support levels.
- Nearby resistance becomes increasingly weaker, enhancing the likelihood of a bull breakout.
- Limited downside risks ahead.

Shiba Inu price action has outperformed a good chunk of the altcoin market. SHIBA has performed admirably despite experiencing intense selling pressure leading up to and after the US CPI data last Thursday. Most importantly, it has held onto the daily Tenkan-Sen as its primary support level.
Shiba Inu price could repeat the same breakout it experienced in October 2021
Shiba Inu price is positioning itself for one of the most sought-after buy entry setups within the Ichimoku Kinko Hyo system: the Ideal Bullish Ichimoku Breakout. The Ideal Bullish Ichimoku Breakout was the entry setup that initiated the rally in October 2021. The rules for this setup are as follows:
- The current close is above the Tenkan-Sen and Kijun-Sen.
- The Tenkan-Sen is above the Kijun-Sen
- If the Tenkan-Sen is below the Kijun-Sen, then the Tenkan-Sen must be pointing up while the Kijun-Sen is flat or pointing down.
- The current close is above the Cloud (Senkou Span A and Senkou Span B).
- Future Senkou Span A is above Future Senkou Span B
- If Future Senkou Senkou Span A is below Future Senkou Span B, then Future Senkou Span A must be pointing up while Future Senkou Span B is pointing flat or pointing down.
- The Chikou Span is above the bodies of the candlesticks and in open space (open space is a condition where the Chikou Span won’t intercept the body of a candlestick over the next five to ten periods, horizontally).
All of the conditions above, save one, are fulfilled. The last puzzle piece is the current daily candlestick closing above the Ichimoku Cloud. For that to happen today, Shiba Inu price would need to close at $0.000040. However, by February 16, that threshold drops to $0.000032.
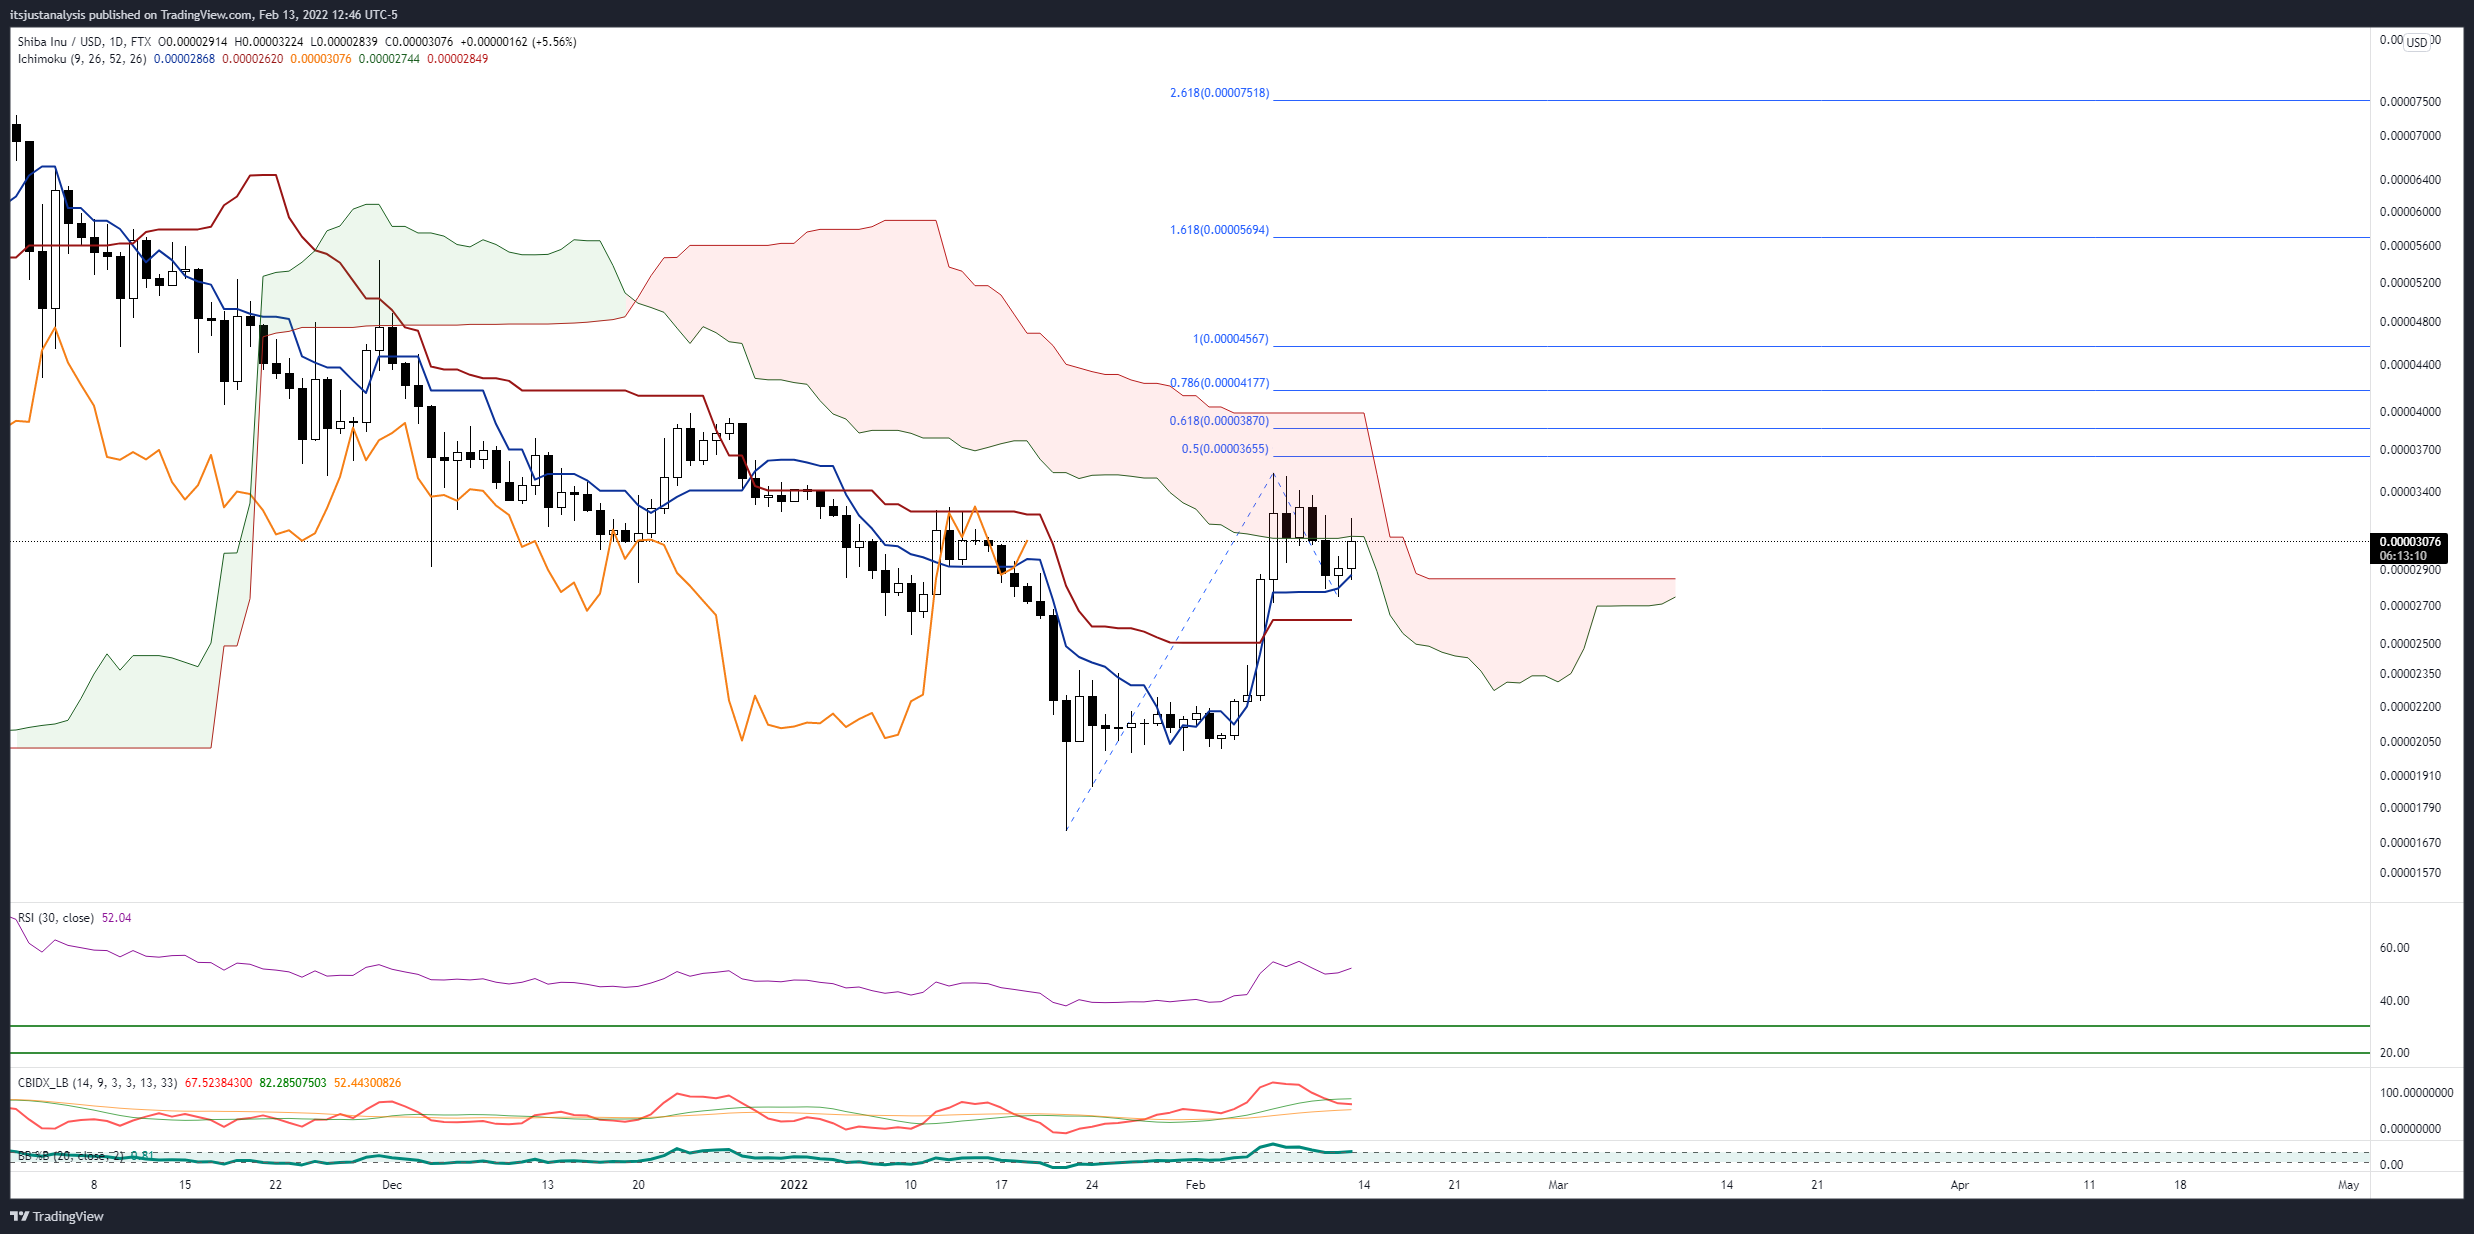
SHIBA/USDT Daily Ichimoku Kinko Hyo Chart
If bulls close Shiba Inu price above the Cloud, the next resistance zone would likely be the 100% Fibonacci expansion at $0.000045.
Downside risks for Shiba Inu price remain but are likely limited to the Kijun-Sen at $0.000026 or the lows of the prior range at $0.000021. A daily close at or below $0.000020 would invalidate any near-term bullish outlook.
Author

Jonathan Morgan
Independent Analyst
Jonathan has been working as an Independent future, forex, and cryptocurrency trader and analyst for 8 years. He also has been writing for the past 5 years.



