Shiba Inu price at risk of falling 50% as SHIB faces multiple obstacles ahead
- Shiba Inu price is stuck in consolidation after weeks of continuous declining trading volume.
- SHIB could see a decline of over 50%, marking a lower low if it fails to break a critical resistance level.
- A significant reduction in social volume for the meme adds credence to the bearish outlook.

Shiba Inu price has slipped into consolidation after its hype subsided in mid-May. Now, SHIB has been stuck in a range of lower highs and slightly higher lows as indecision mounts.
Shiba Inu price faces stiff resistance ahead
Shiba Inu price is currently around 40% up from its low recorded on May 19 at $0.00000629. While SHIB is trying to make a comeback, revisiting all-time highs remains distant as the meme token would need to surge 480% for a retest.
On the 4-hour chart, Shiba Inu price has been coiling within a symmetrical triangle pattern, indicating a heightened level of indecision. The pattern’s upper trend line is formed by connecting the continuous lower highs, while the slightly higher lows of the SHIB price action have formed the lower trend line.
The measured move of the SHIB triangle is approximately 51%, creating a lower target of $0.00000403, and an upside target of $0.00001476. During this period of indecision and lack of buying pressure, Shiba Inu price could be at risk of a downward trend.
It is important to note that the SHIB price is currently struggling to move above the 50 four-hour moving average and the 100 four-hour moving average. These two indicators act as stiff resistance for Shiba Inu, especially when its volume has been dwindling.
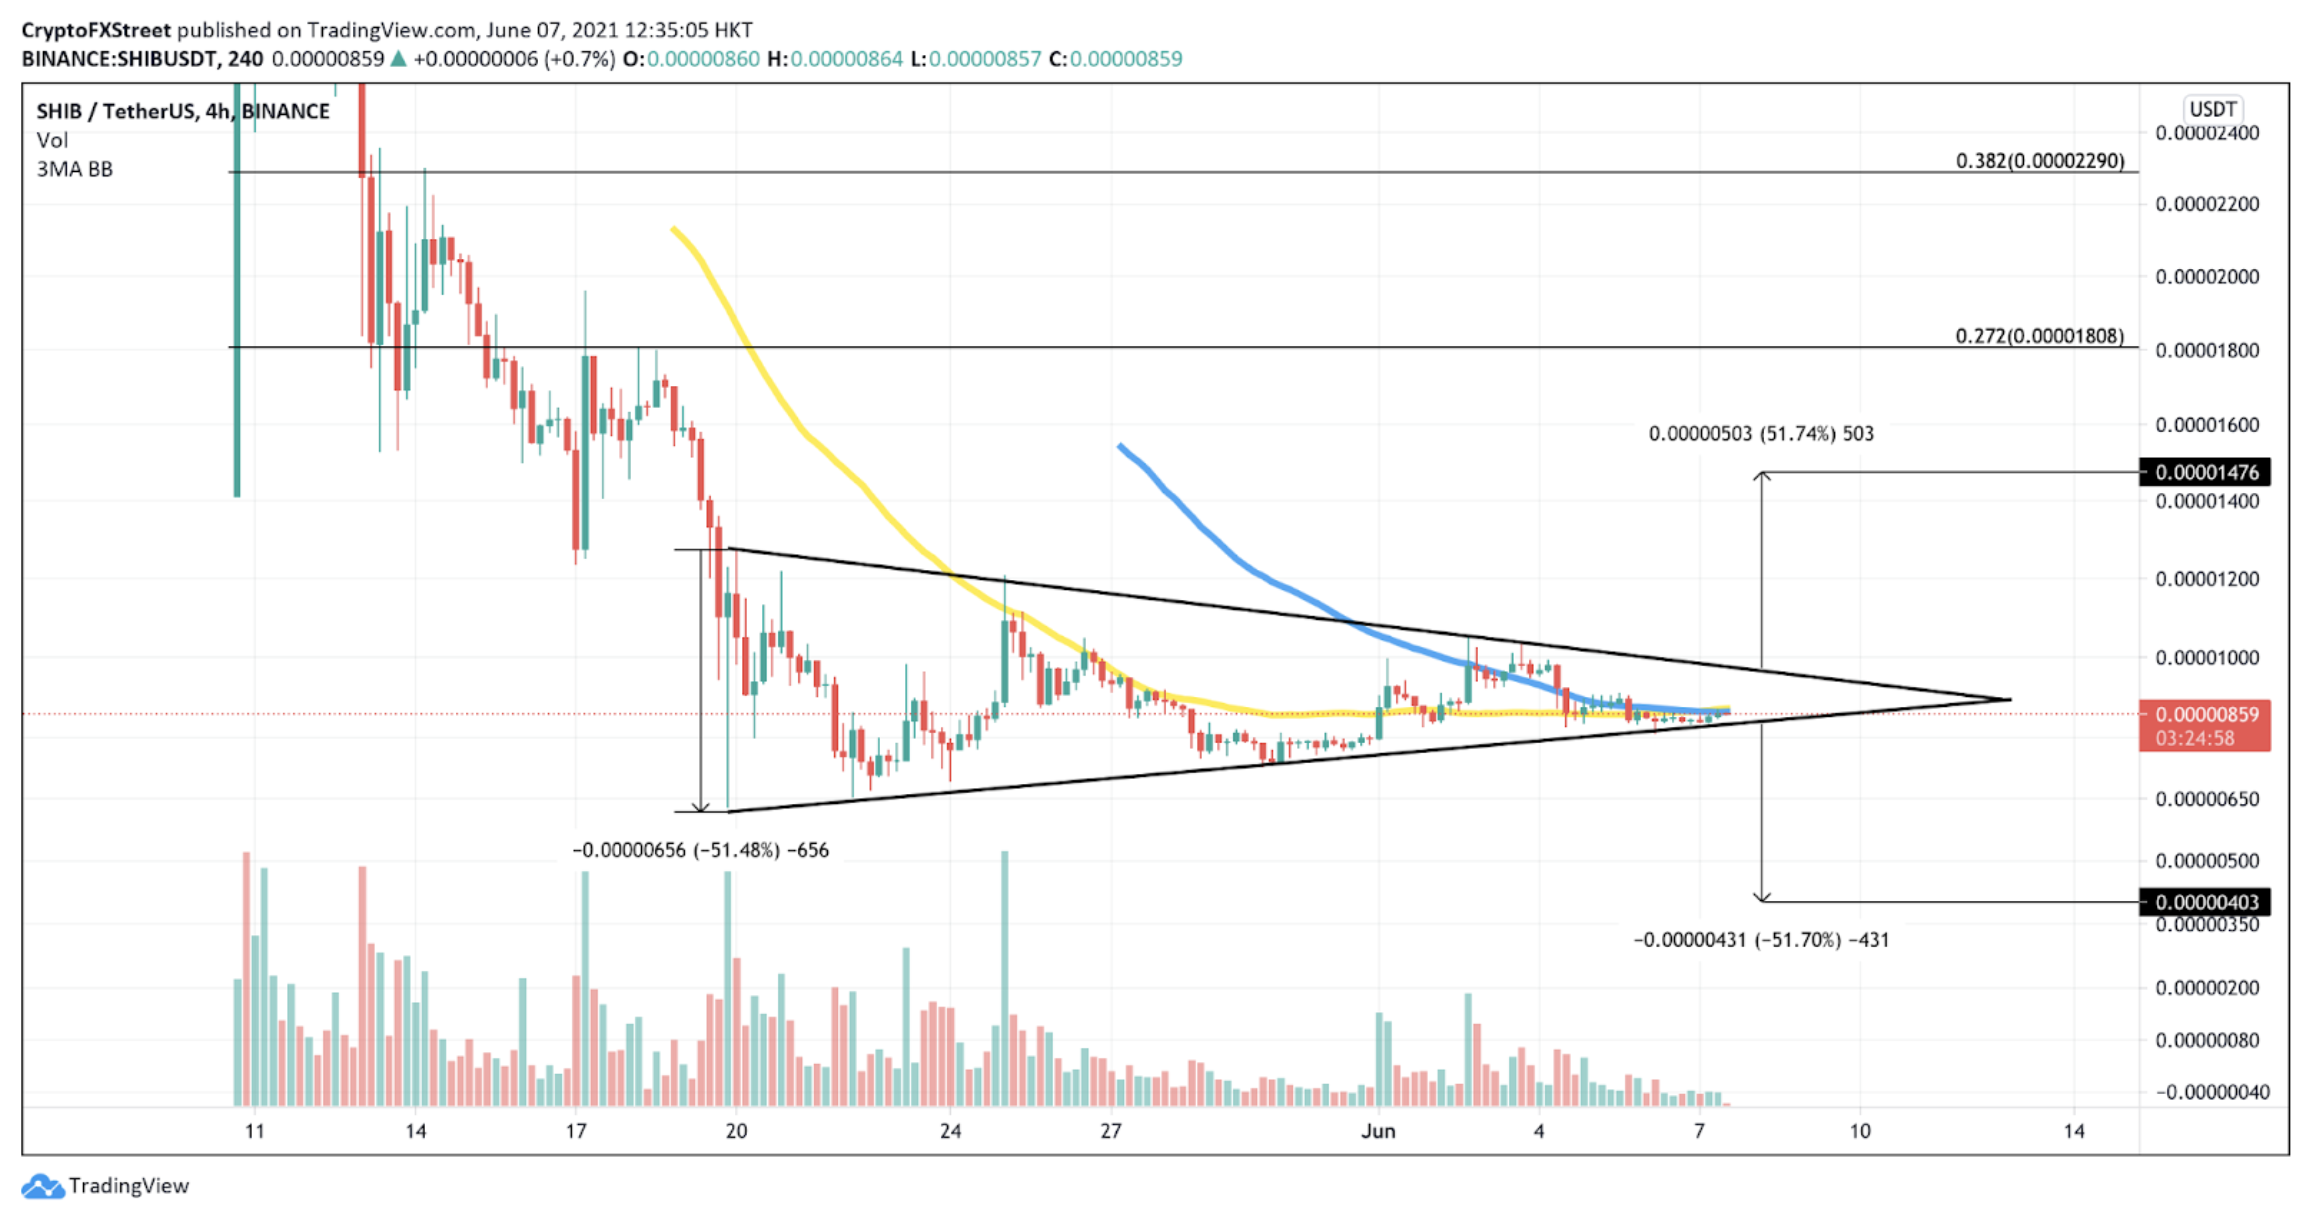
SHIB/USDt 4-hour chart
SHIB social volume has continued to decrease since its all-time high on May 10, despite several sparse peaks in the past month. While there was a massive spike in social volume on May 25, Shiba Inu price has failed to follow suit.
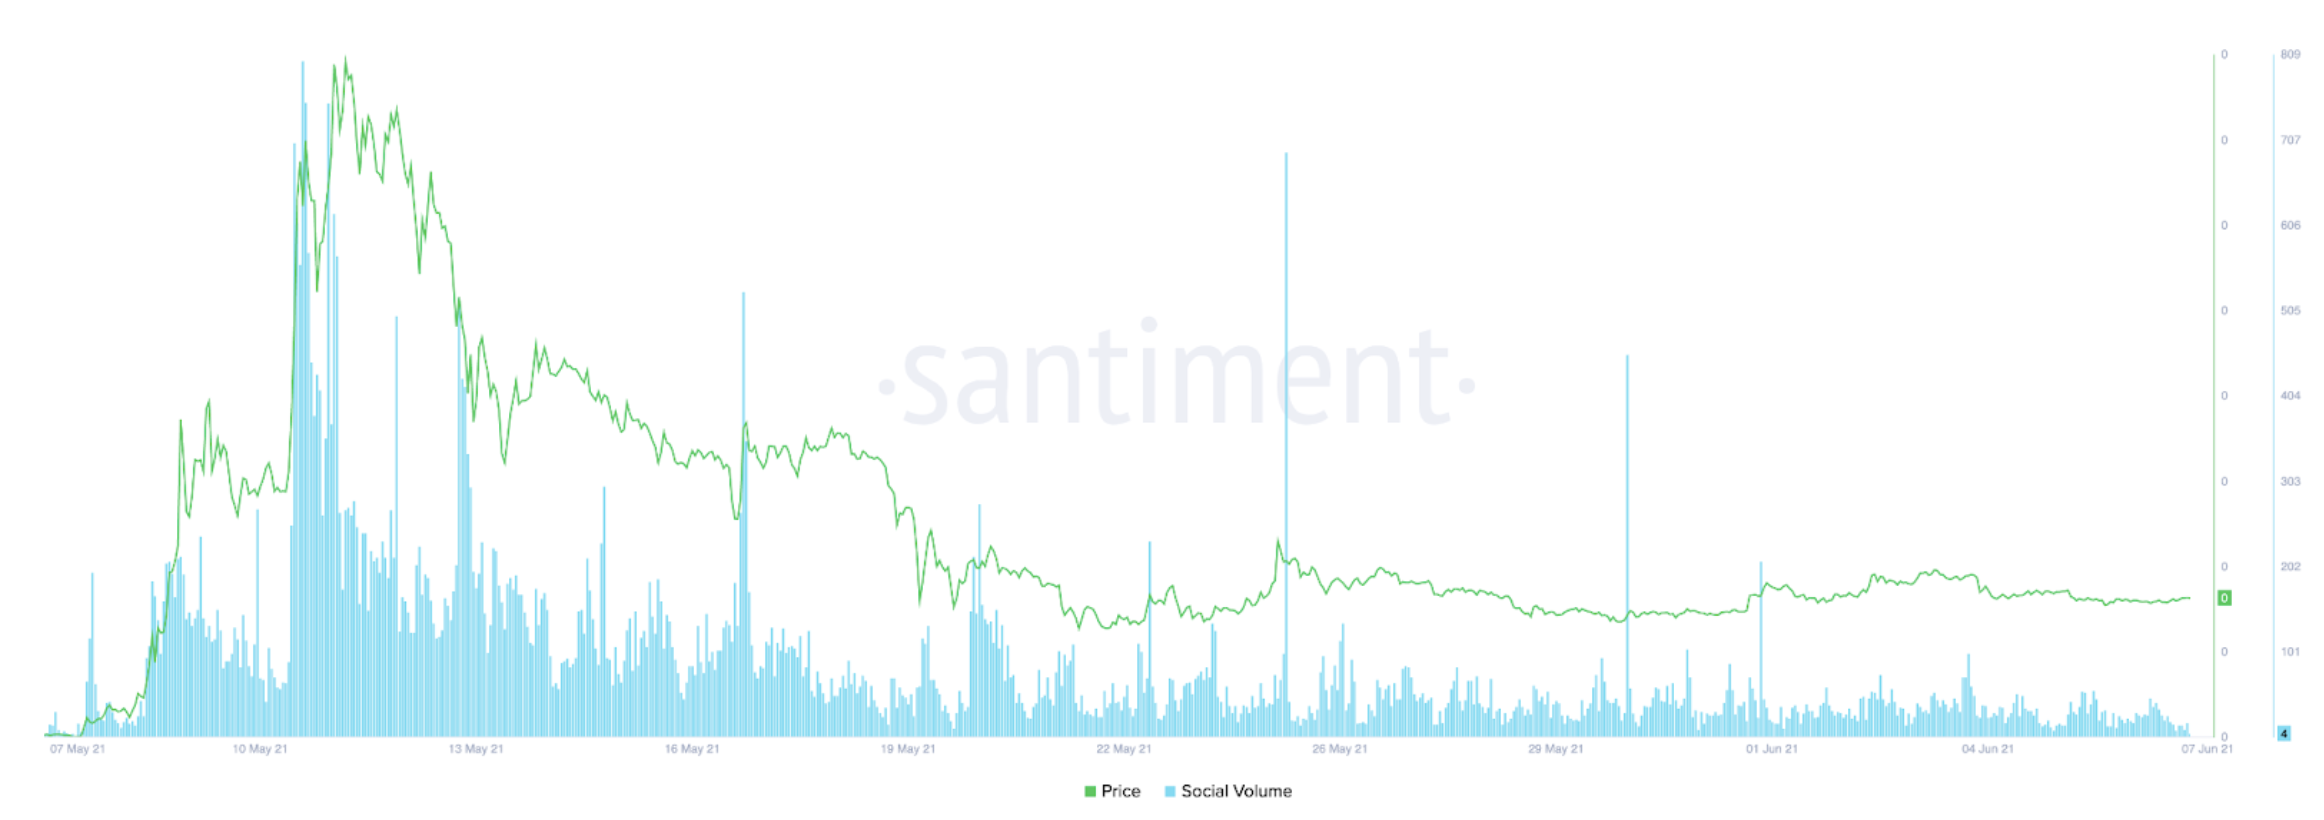
Shiba Inu Social Volume
According to the social metric, Shiba Inu price has not been able to draw speculators’ attention. SHIB bulls should closely observe the meme coin’s price action as it tags the lower trend line of the symmetrical attention.
The bearish outlook could materialize if Shiba Inu price fails to hold support at the downside trend line of the chart pattern, leading to a 50% decline.
However, should a sudden spike in buying pressure transpire, Shiba Inu must break above the 50 and 100 four-hour moving averages and hold these levels as support before the bearish outlook is voided and raise the probability of SHIB price heading towards the aforementioned upper target.
Author

Sarah Tran
Independent Analyst
Sarah has closely followed the growth of blockchain technology and its adoption since 2016.




