Shiba Inu is likely on the brink of SHIB price rally as meme coin sees volume capitulate
- Shiba Inu’s holders realized large volume losses on their SHIB holdings between February 8 and 20.
- SHIB volume on exchanges has been in a downward trend for three months, it is 77.78 trillion on Tuesday.
- Shiba Inu price declined slightly to 0.00000987 on Tuesday.

Shiba Inu, one of the largest meme coins in the crypto ecosystem, observed a large capitulation by SHIB holders in the past two weeks. This could result in a massive rally in SHIB price, if the trend repeats itself. On-chain metrics support Shiba Inu’s uptrend.
Also read: Altcoins facing a risk of correction after massive rally: Cardano, Chiliz, Fetch.AI, Lido, The Graph
On-chain metrics support SHIB price gains thesis
Shiba Inu has observed large volume capitulation in several instances in the past twelve months. Each instance where SHIB holders realized losses in large volumes, there are massive gains in the meme coin’s price. As seen in March 2023 and July 2023, SHIB price rallied to its local top as SHIB holders realized losses.
If the trend repeats, SHIB price could soon rally to a local peak in the coming weeks and months. The Santiment chart below shows large volume transactions valued at $100,000 and higher and volume of losses realized by traders between February 8 and 20.
 [17.02.36, 20 Feb, 2024]-638440290585089103.png)
Shiba Inu Whale Transactions and Network Realized Profit/Loss
The meme coin’s Supply on Exchanges has been in a consistent state of decline since November 22, 2023. SHIB supply dropped from 85.11 trillion to 77.78 trillion between November 22 and February 20. This marks a significant decline in SHIB supply on exchanges, supporting the thesis of SHIB price gains, as selling pressure on the meme coin decreases.
 [17.04.43, 20 Feb, 2024]-638440290863766050.png)
SHIB Supply on Exchanges. Source: Santiment
Shiba Inu price could rally towards 2024 peak
At the time of writing, Shiba Inu price is $0.0000987. The meme coin is currently above support at the 50% Fibonacci retracement of the decline from 2024 peak to January low, at $0.0000968. SHIB faces resistance at the 61.8% and 78.6% Fib retracement at $0.0000997 and $0.00001039. The target is Shiba Inu’s 2024 peak of $0.00001093.
The Moving Average Convergence/ Divergence indicator suggests that there is positive momentum. The Awesome Oscillator indicates SHIB’s uptrend could shift, SHIB could therefore sweep support at $0.0000968 before rallying towards its target.
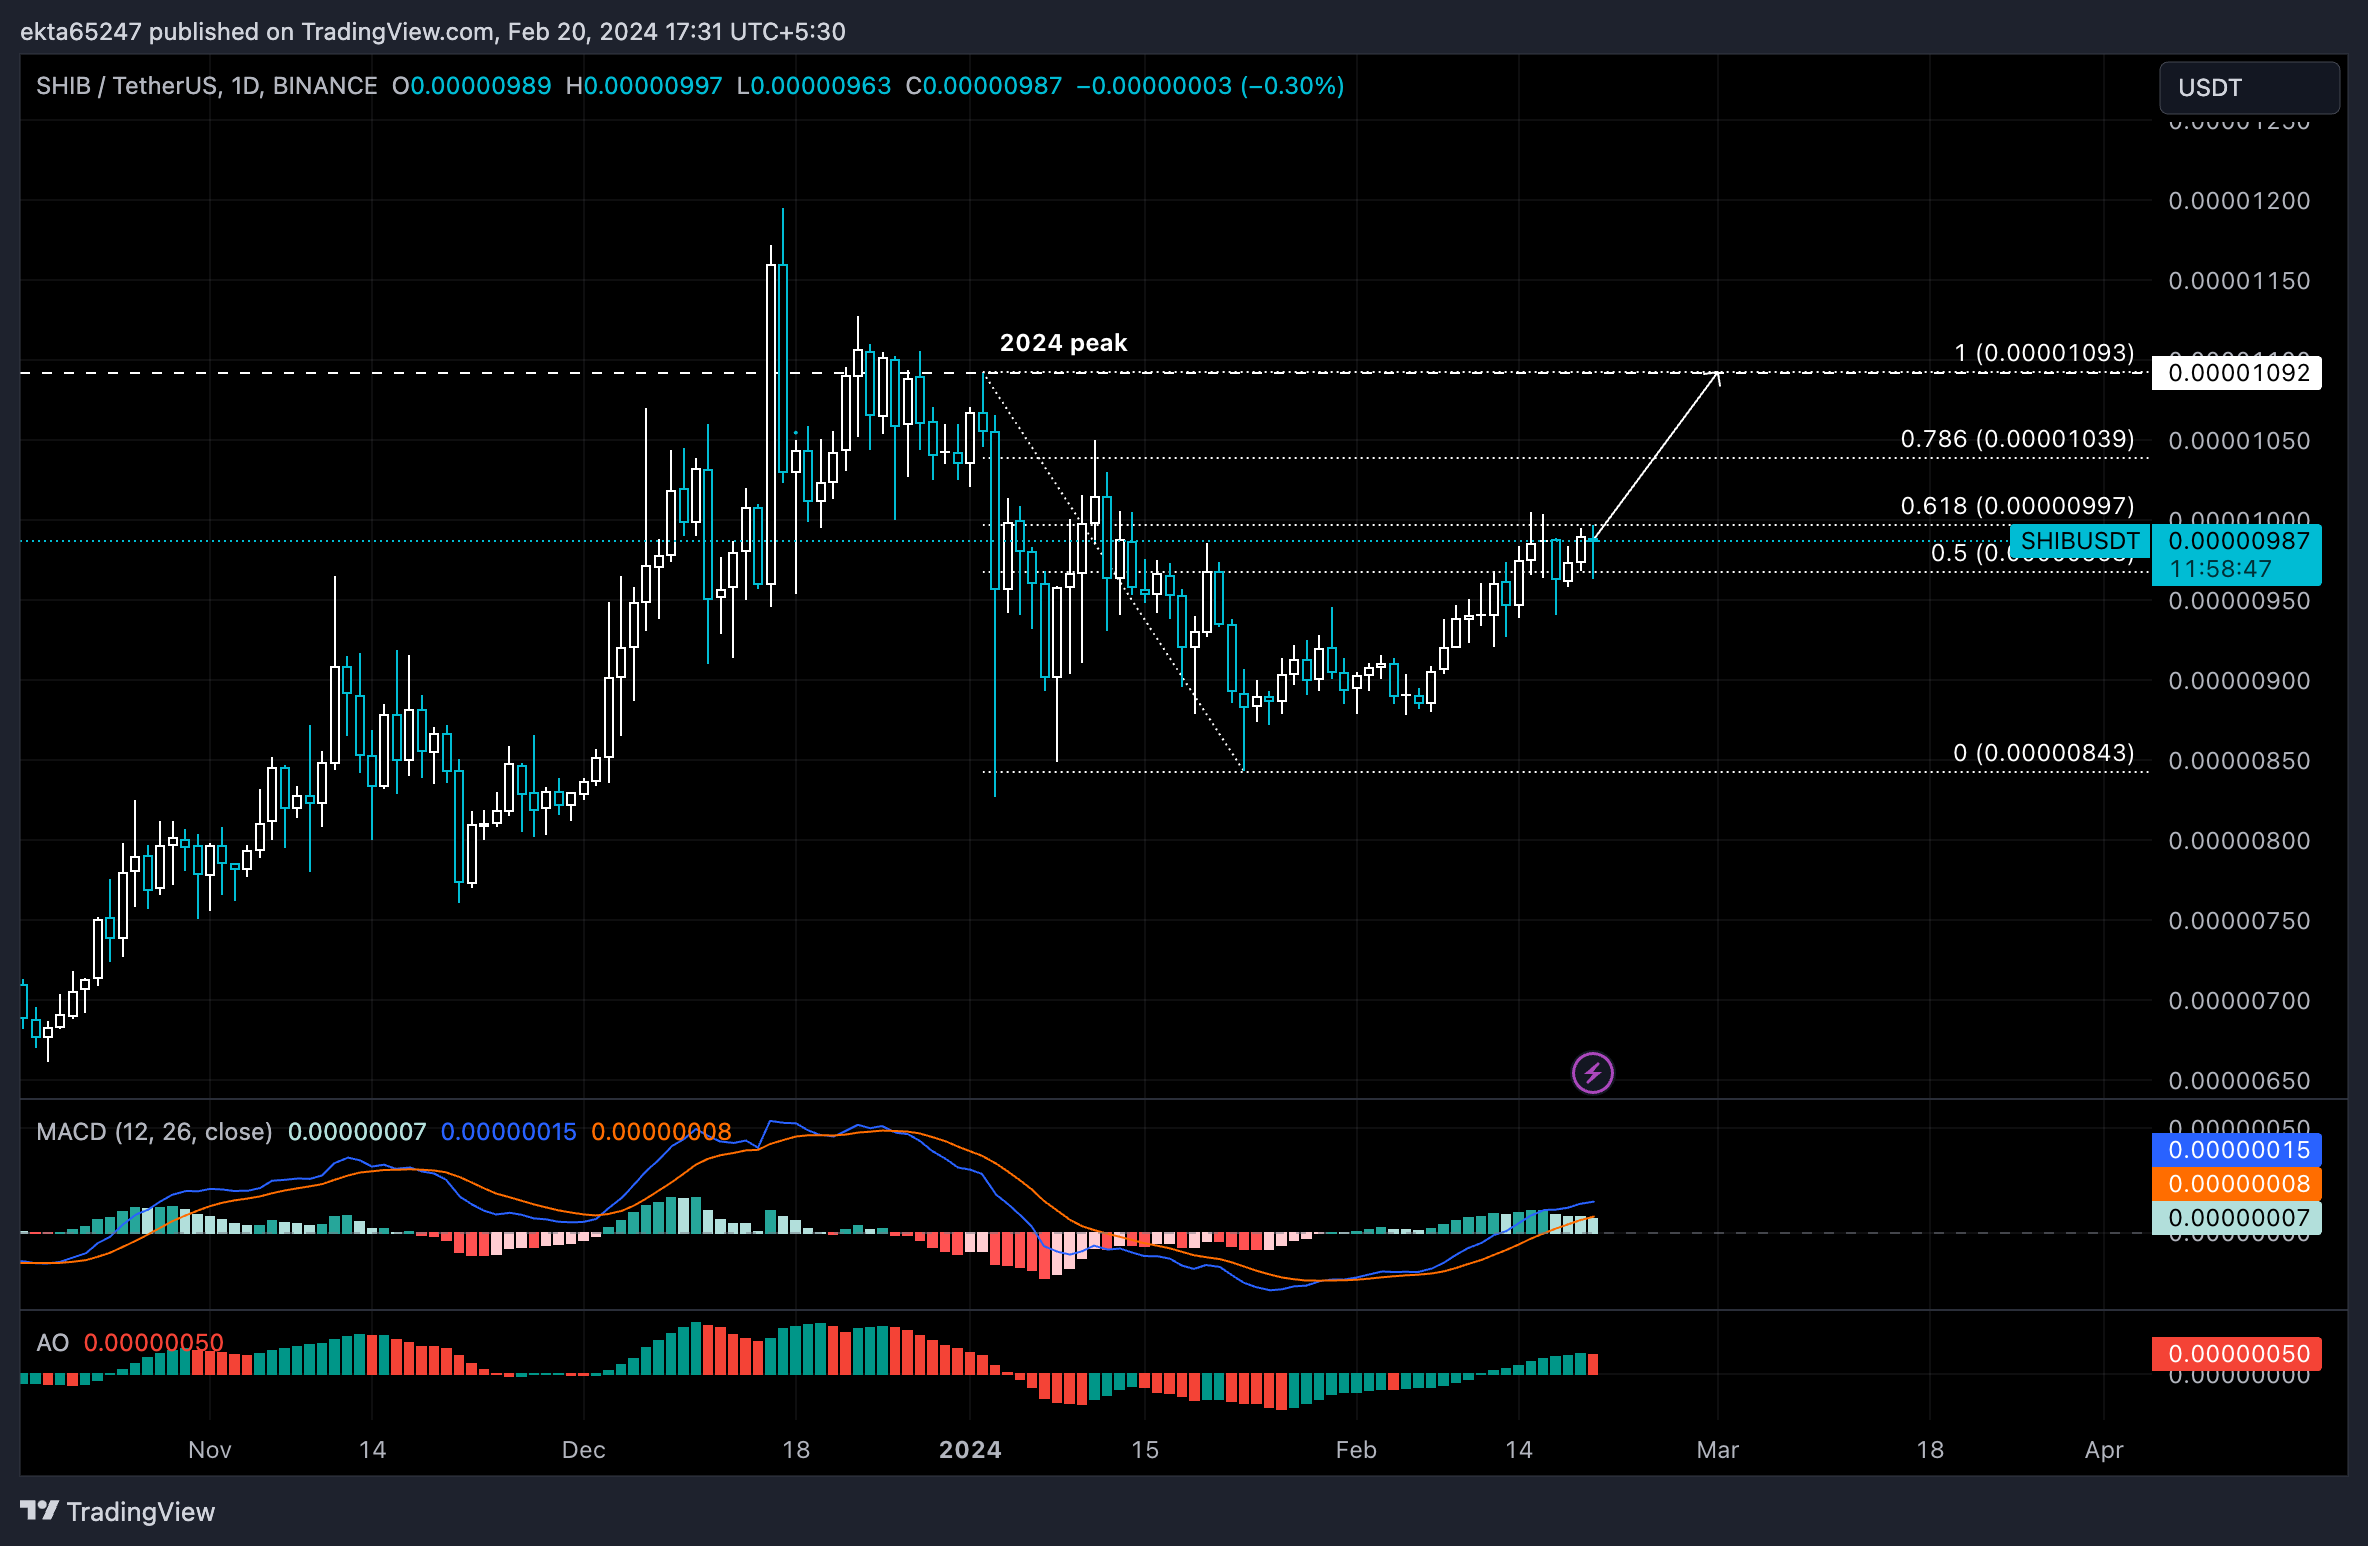
SHIB/USDT 1-day chart
A daily candlestick close below the 50% Fib retracement could invalidate the bullish thesis for Shiba Inu price.
Author

Ekta Mourya
FXStreet
Ekta Mourya has extensive experience in fundamental and on-chain analysis, particularly focused on impact of macroeconomics and central bank policies on cryptocurrencies.



