Shiba Inu has potential for rally but faces key technical hurdles
- Nearly 73% of SHIB is held at a loss after its price fell below a key accumulation zone.
- SHIB holders could shed their holdings if its price reclaims the $0.0000170 level, a historical level with high sell pressure.
- SHIB could rise to $0.0000144 after posting a "Golden Cross" signal but faces major resistance around the 50-day SMA.
Shiba Inu (SHIB) is down 0.1% on Wednesday following loss of a key accumulation zone. Meanwhile, its on-chain and technical indicators suggest potential for a brief rally.
SHIB on-chain metrics suggest it's still in buy zone
According to data from IntoTheBlock, nearly 73% of SHIB tokens are held at a loss after the meme coin lost the $0.0000170 support, around which investors purchased 496.48 trillion SHIB.
This is the largest accumulation zone of SHIB, and a reclaim of this level could help establish critical support for the token, or it could lead to a decline if investors decide to shed holdings after they break even.
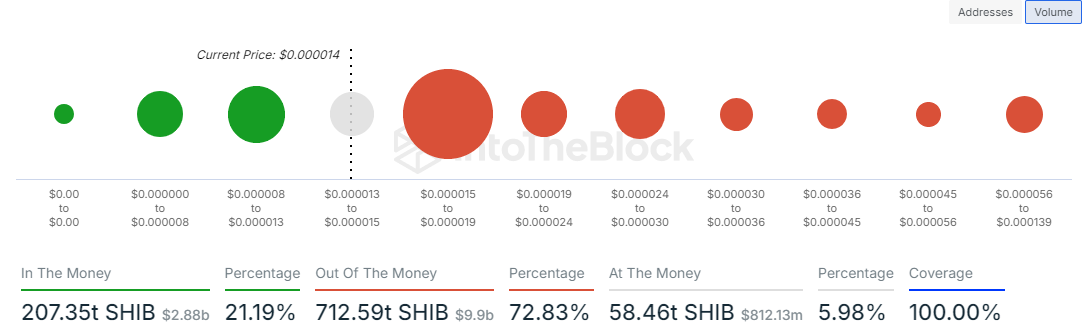
SHIB Global In/Out of the Money
This is evidenced in Santiment's data, which shows a spike in the movement of SHIB coins that have been dormant in the past year on July 18, when their price reached the $0.0000170 mark. SHIB's exchange flows experienced a similar spike on the same day, confirming the high volatility and potential sell pressure around the price.
Meanwhile, despite the slight price decline, the market crash on August 5 didn't have much effect on SHIB investors, as net flows and dormant coins in circulation didn't see the typical major spikes during such market declines.
The Weighted Sentiment of SHIB has declined to -0.7, and its 30-day Market Value to Realized Value (MVRV) Ratio is at -11.9%, indicating all SHIB investors within the last 30 days are at an average loss of 11%.
 [00.28.58, 14 Aug, 2024]-638591957694987274.png)
SHIB On-chain Metrics
The on-chain data above suggest SHIB may still be in a buy zone, especially with the large number of coins held at a loss.
50-day SMA could hinder SHIB’s potential for upward trend
SHIB posted a "Golden Cross" after its 100-day Simple Moving Average (SMA) crossed above the 200-day SMA. Such a move is often interpreted as the confirmation of a new upward trend.
However, an earlier "Death Cross" move by the 50-day SMA crossing below the 100-day SMA on July 17 could serve as a resistance for an upward move. SHIB also faces a resistance of a descending trendline from March 8.
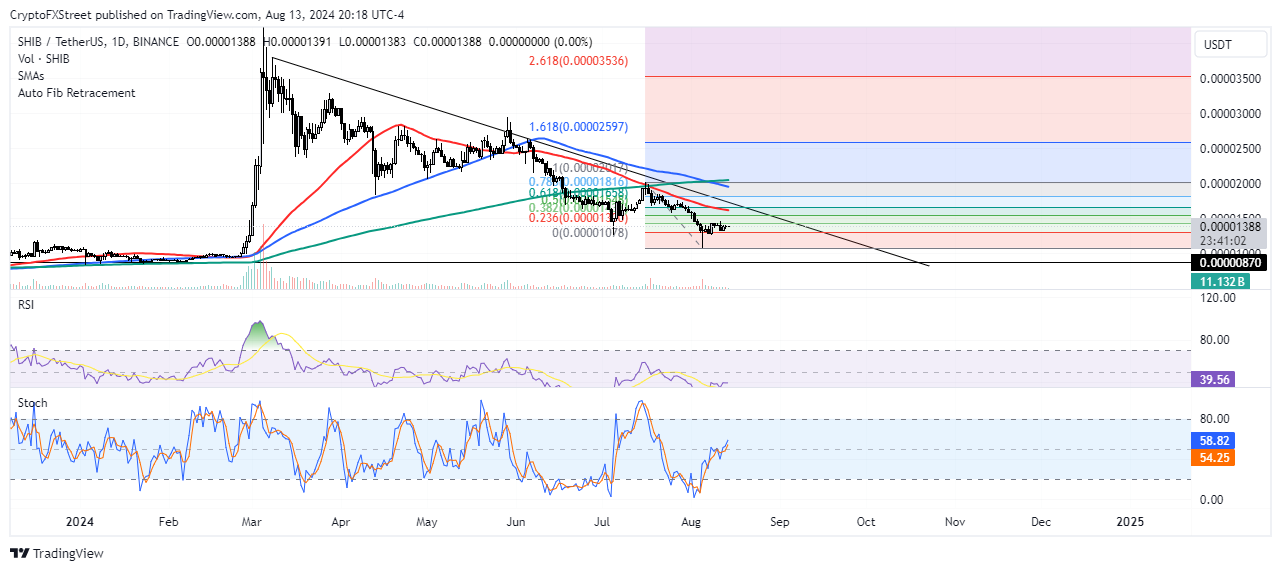
SHIB/USDT Daily chart
Hence, the next main target for SHIB is the 38.2% Fibonacci retracement level, which is around $0.0000144. A breach of $0.0000087 will invalidate the thesis and send SHIB into a massive correction.
This analysis is subject to the price movement of Bitcoin as meme coins often mimics its price.
Author

Michael Ebiekutan
FXStreet
With a deep passion for web3 technology, he's collaborated with industry-leading brands like Mara, ITAK, and FXStreet in delivering groundbreaking reports on web3's transformative potential across diverse sectors. In addition to


