SHIB price fades under the spotlight with Shiba Inu dangerously close to a major decline
- SHIB price is shaping a descending triangle pattern on the one-hour chart.
- Secondary trend line now limiting intra-day rebounds.
- Shiba Inu market capitalization stands around $17 billion, exceeding VeChain and Ethereum Classic.
SHIB price slump to the lower trend line of the descending triangle has been methodical, lacking sharp moves on the one-hour chart. The introduction of a secondary trend line and the declining 50 one-hour simple moving average (SMA) increases the downward pressure on the token and the odds of a breakdown in the next few hours.
SHIB price popularity proves short-lived after Buterin gift
A descending triangle is a bearish pattern and follows an established trend, albeit short in the case of Shiba Inu. However, the SHIB price downtrend preceding the developing triangle was robust and totaled over 60% from May 10 to May 12.
To expand on the descending triangle, there must be two reaction lows at the horizontal trend line, but the lows do not have to be the same price but within proximity of each other. It is better if there is some space between the lows and a reaction in between. Like the lower trend line, there must be two reaction highs at the descending trend line, and those highs should be continually lower, with some space between them. If any reaction high is equal or greater than the previous reaction high, the descending triangle is invalidated.
In general, a descending triangle can last a few weeks or even months. Due to the short SHIB price history, the length of the pattern is being measured on the one-hour chart.
Volume should contract during the pattern development and then, ideally, spike upon resolution to the downside.
The measured move target of the descending triangle pattern is calculated by measuring the widest distance of the pattern and subtracting it from the horizontal trend line.
Based on that brief overview, it is clear that SHIB price illustrates a descending triangle pattern. The pattern shows at least two reactions on each trend with some space between the alternating reactions. The volume has largely been muted during the pattern formation, excluding the brief test of the horizontal trend line yesterday.
The measured move target of the SHIB price pattern is $0.00000966, or a 36% decline from the horizontal trend line at $0.00001510. Concerning the current price, it is about a 36% decline as Shiba Inu currently sits on the horizontal trend line.
The secondary trend line drawn from the May 13 high has squeezed SHIB price into tight space that projects a resolution to the pattern in a matter of hours. If Shiba Inu does overcome the secondary trend line at $0.00001579 and the 50 one-hour SMA at $0.00001692, the token will likely rally to the descending trend line at $0.00002079 for a third reaction high.
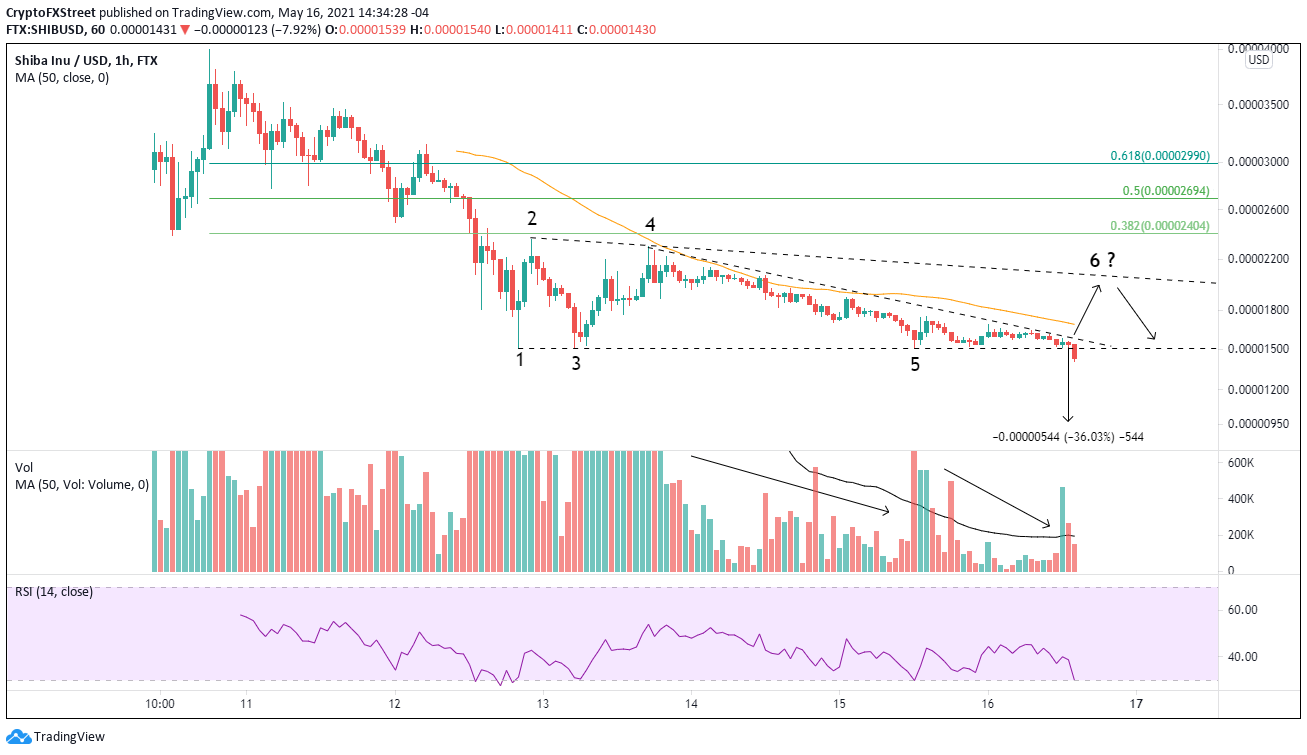
SHIB/USD 1-hour chart
All the variables are aligned for a downward resolution of the triangle. Still, investors need to be aware that things can change quickly with social media hyped tokens, particularly newly minted. A SHIB price surge above the second reaction high at $0.000023.05 will void the bearish thesis argued by the descending triangle pattern and bump the probability higher that Shiba Inu rushes towards the 38.2% and 50% retracement levels of the May 10 to May 12 decline at $0.00002404 and $0.00002694, respectively.
It is essential for all investors who want to traffic in a new cryptocurrency like Shiba Inu to take position sizing and risk management very seriously. There is limited price history to generate technical indicator readings that can validate pattern construction and outcomes.
Author

Sheldon McIntyre, CMT
Independent Analyst
Sheldon has 24 years of investment experience holding various positions in companies based in the United States and Chile. His core competencies include BRIC and G-10 equity markets, swing and position trading and technical analysis.


