SHIB Price Prediction: Shiba Inu hype may not prevent a 50% decline
- SHIB price may be in the process of framing a descending triangle pattern.
- 50 one-hour simple moving average (SMA) has begun to provide resistance over the last 24 hours.
- Volume has notably declined today, characteristic of descending triangle patterns.
SHIB price has been consolidating today after the significant decline related to Vitalik Buterin’s decision to donate $1 billion worth of Shiba Inu to the India COVID Relief Fund. The emerging descending triangle projects lower prices for Shiba Inu moving forward.
SHIB price jitters are part of the bottoming process
A descending triangle is a bearish pattern and follows an established trend, albeit short in the case of Shiba Inu. However, as long as the pattern is robust, it can be used to anticipate price moves.
To be specific, there must be two reaction lows at the horizontal trend line, but the lows do not have to be exact, but within reasonable proximity of each other, as is the case with Shiba Inu. It is better if there is some space between the lows and a reaction high between them. There must also be two reaction highs at the descending trend line, and the highs should be successively lower, with some distance between them. If a reaction high equals or is greater than the previous reaction high, the descending triangle is not valid.
In the case of SHIB price history, the length of the pattern will be measured in hours, but generally, descending triangles can last a few weeks or some cases, months.
During the pattern development, the volume should contract and spike upon the resolution of the pattern.
The measured move target of the pattern is calculated by measuring the widest distance of the pattern and subtracting it from the horizontal trend line.
With that framework, it is clear that SHIB price has defined a descending triangle pattern with two reactions on each trend line that have alternated and a gradual decline in volume.
The measured move target of the SHIB price pattern is $0.00000966, or a 36% decline from the horizontal trend line at $0.00001510. More importantly to current bullish investors, it equates to a 50% decline from the current price, $0.00001875.
SHIB price could still test the descending trend line at $0.00002212 before falling into the decline. It is crucial to ensure that the reaction high is below the previous reaction high at $0.00002298.
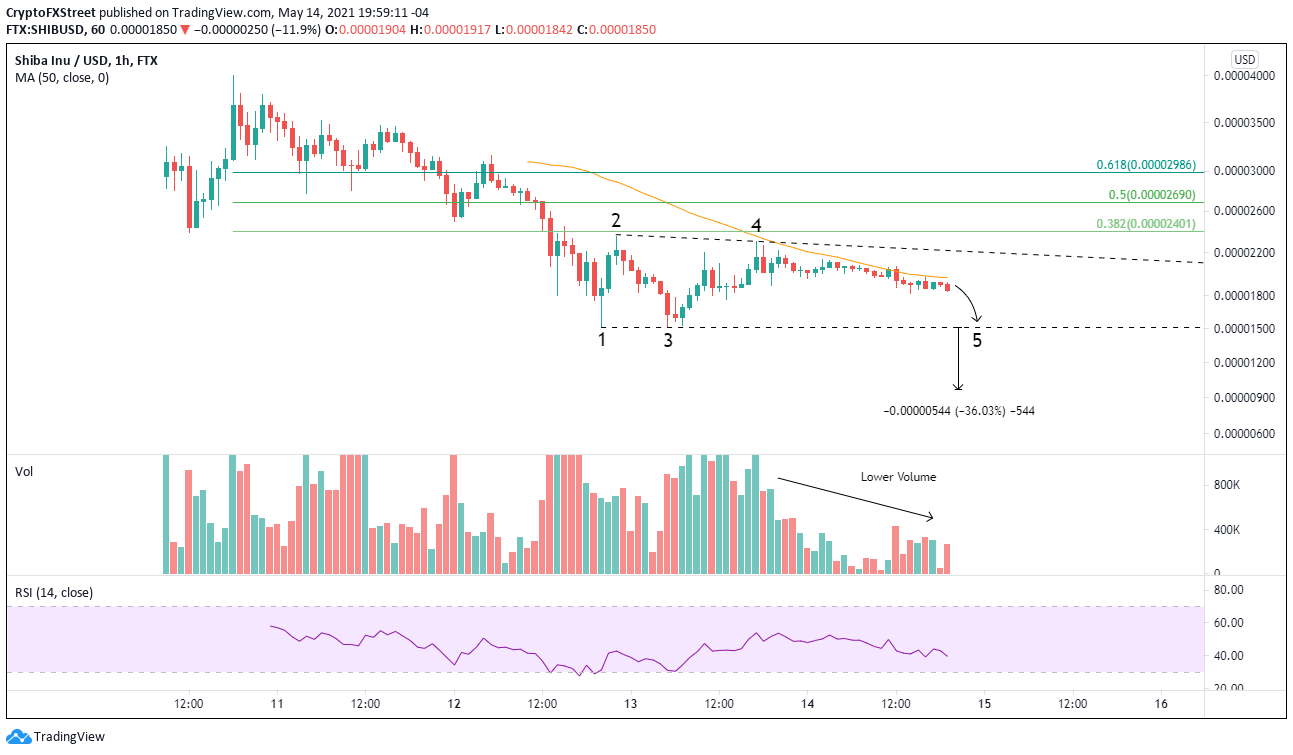
SHIB/USD 1-hour chart
While Shiba Inu appears to be headed lower, investors must recognize that things can change quickly with newly minted cryptocurrencies. A SHIB price surge above $0.00002298 will void the bearish outlook afforded by the descending triangle pattern and raise the probability that Shiba Inu rushes towards the 38.2% and 50% Fibonacci retracement levels of the May 10 to May 12 decline at $0.00002401 and $0.00002690, respectively.
It is important for investors that want to traffic in a new cryptocurrency like Shiba Inu to take risk management very seriously because there is limited price history to generate technical indicator readings that can validate pattern construction and outcomes.
Author

Sheldon McIntyre, CMT
Independent Analyst
Sheldon has 24 years of investment experience holding various positions in companies based in the United States and Chile. His core competencies include BRIC and G-10 equity markets, swing and position trading and technical analysis.


