Sandbox Price Prediction: 40% bull rally at risk of terminating
- Sandbox price continues to rally from two-month lows.
- A bearish continuation move is likely if bulls fail to push SAND back into its bull flag.
- Sandbox remains in extreme oversold conditions.

Sandbox price has made some wild price swings this week. From the open, it has moved from $3.34 to $2.55 – a 23% drop. Then, SAND rallied nearly 40% to $3.55 from the weekly low at $2.55. Selling pressure resumed upon hitting the weekly high.
Sandbox price pauses after the massive rally, SAND needs to close near $4 to prevent another push south
Sandbox price is up against a trifecta of significant resistance: the daily Tenkan-Sen at $3.50, the bottom of the bull flag (blue diagonal linear regression channel) at $3.68, and the 38.2% Fibonacci retracement at $3.83. Buyers need to rally SAND to a close above these three resistance levels to deny sellers any opportunity to push Sandbox lower.
The oscillators may provide a slight hint as to which direction is likely to break. The Optex Bands oscillator remains in extreme oversold conditions – it has reached new all-time lows and has spent the longest time in its history at these extreme lows. As a result, the Optex Bands oscillators lean towards a strong push higher. However, the Composite Index shows something different and concerning.
The red arrow on the candlestick chart shows lower highs, while the red arrow on the Composite Index shows flat to higher highs. This is a condition known as hidden bearish divergence, and it is a warning sign that the current corrective move higher is likely to terminate and resume the dominant downtrend. That the hidden bearish divergence developed while Sandbox price has hit a major cluster of resistance is a prime shorting opportunity for sellers.
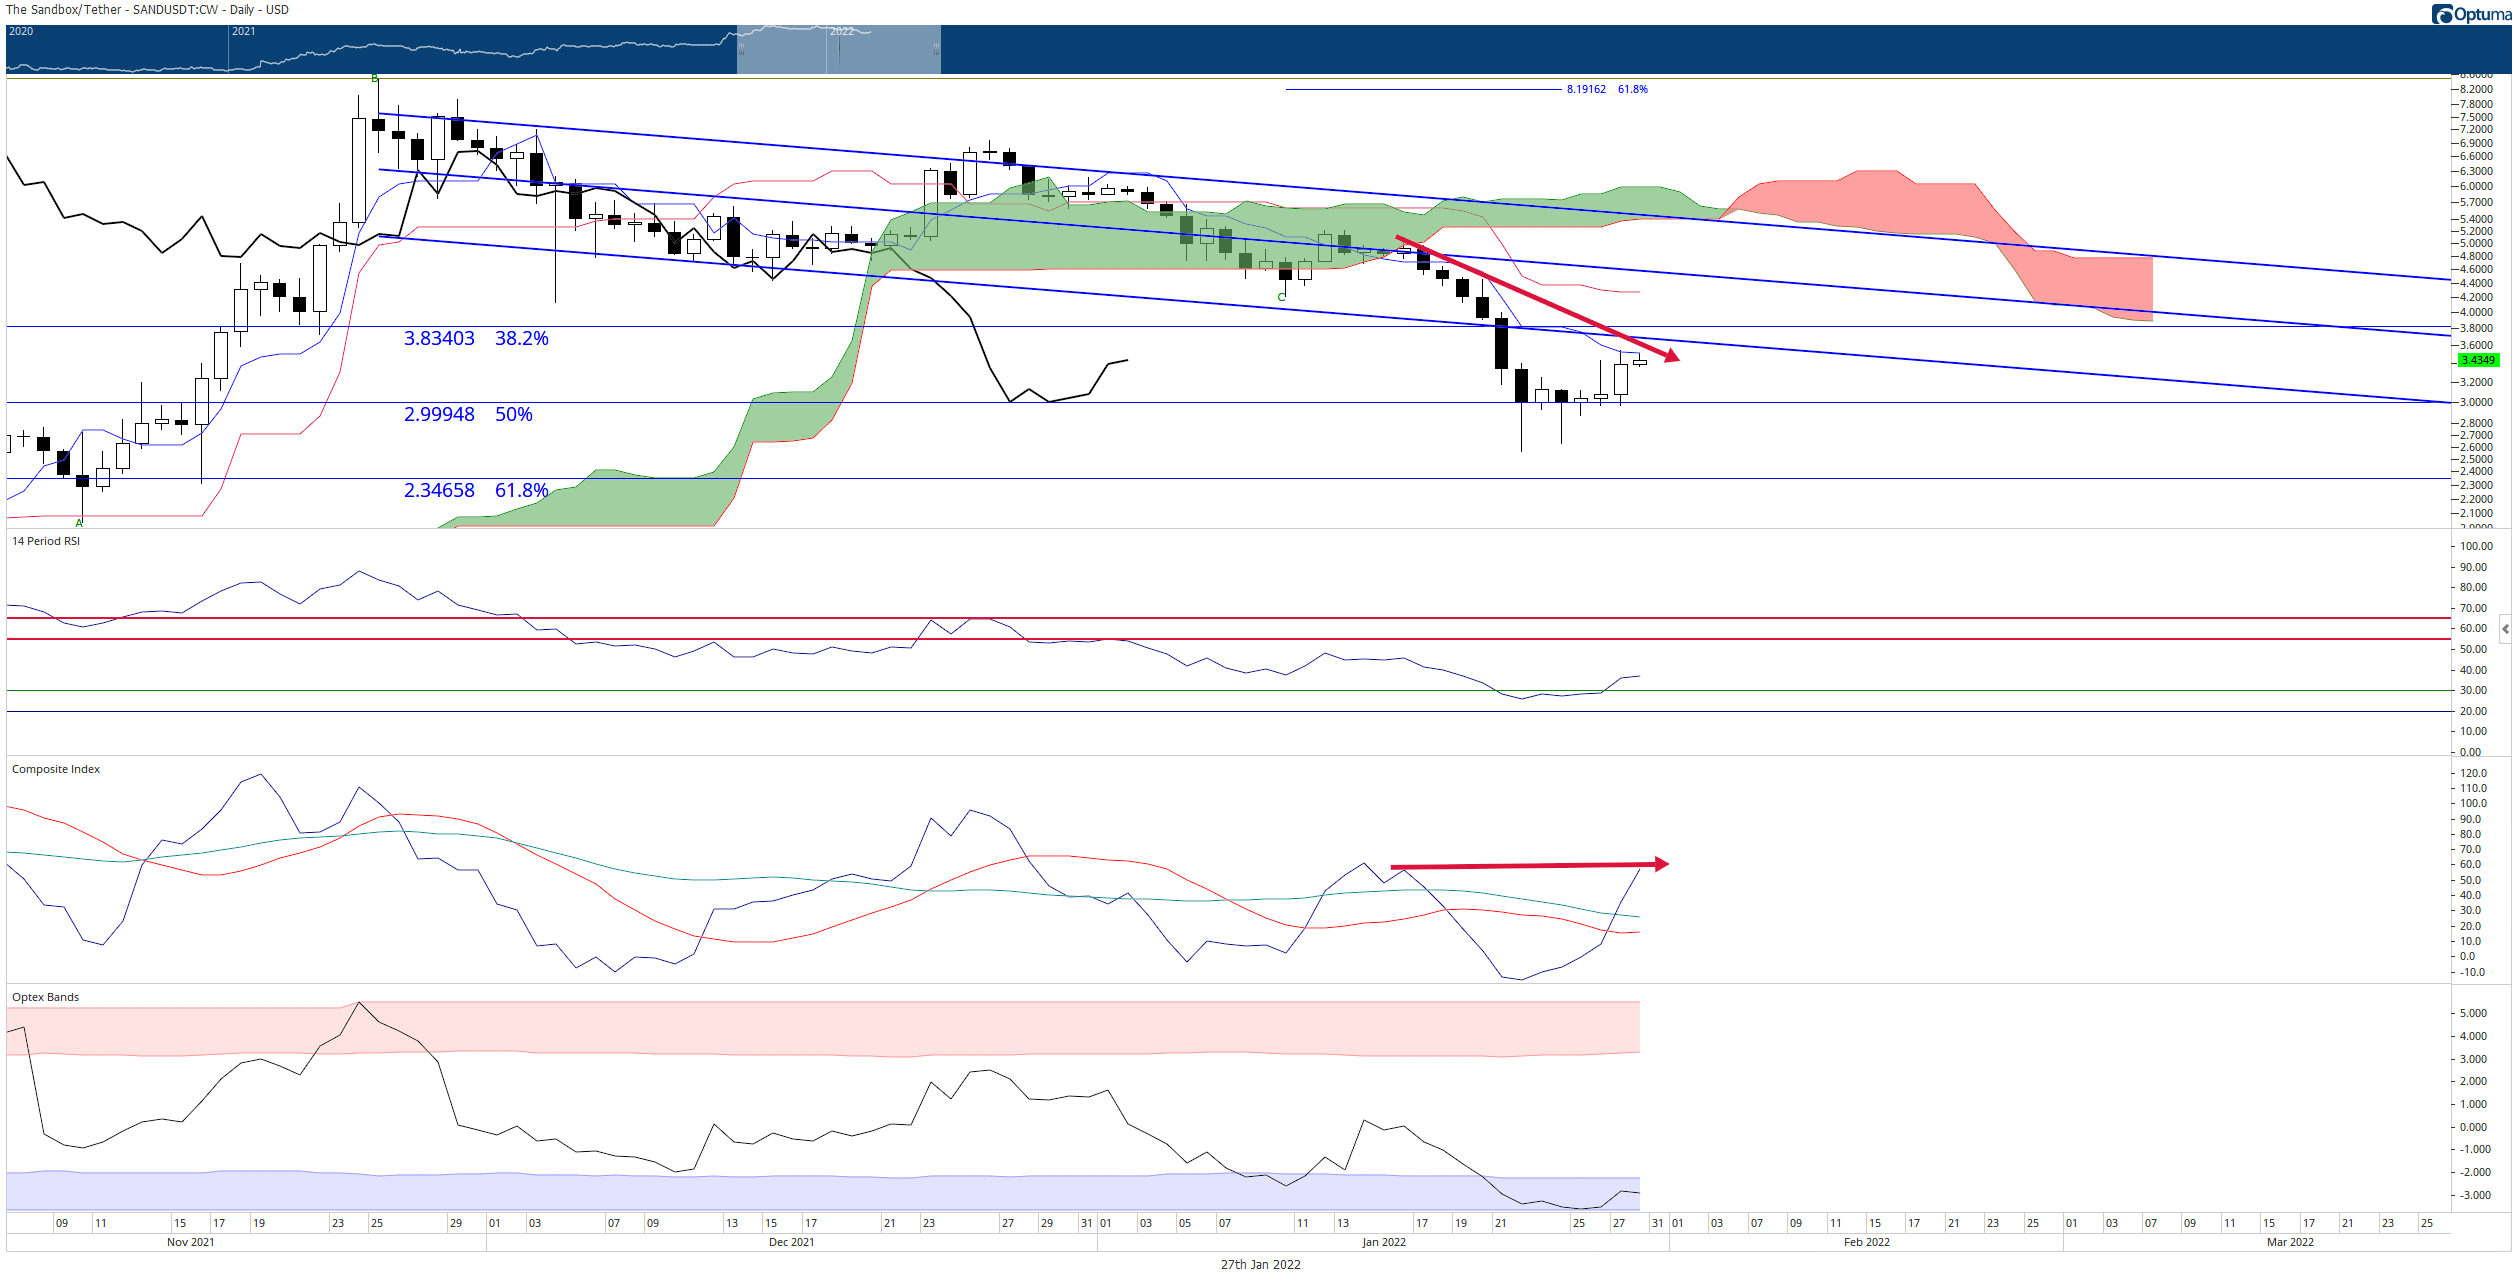
SAND/USDT Daily Ichimoku Kinko Hyo Chart
If bulls want to invalidate a continuation move south, then they will need to rally Sandbox price to a close above the January 16 peak of $4.92. If that occurs, then the hidden bearish divergence is no longer present and not a concern.
Author

Jonathan Morgan
Independent Analyst
Jonathan has been working as an Independent future, forex, and cryptocurrency trader and analyst for 8 years. He also has been writing for the past 5 years.


