- Sandbox has corrected 38% from its all-time high and is retesting crucial support floors, anticipating a move higher.
- A decisive close above $5.5 will confirm an uptrend’s start and trigger a 22% ascent to $6.77.
- If SAND produces a lower low below $3.77, it will invalidate the bullish thesis.
Sandbox has seen a considerable retracement over the past weeks from its record high. The recent pullback after the December 4 flash crash, tagged critical support floors and has triggered a quick recovery. Going forward, investors can expect SAND price to propel higher.
Sandbox bulls face a decisive moment
Sandbox price has dropped roughly 38% from its all-time high at $8.48 to where it currently trades - $5.27. During this descent, SAND price tagged the 70.5% retracement level at $4.28 but quickly moved away from it.
After getting rejected at the trading range’s midpoint and the declining trend line, SAND shows signs of heading higher. Assuming Sandbox produces a higher high above $5.50, it will confirm the start of an uptrend.
In this condition, investors can expect SAND price to retest the $6.77 hurdle. The run-up from $5.27 to $6.77 would constitute a 30% ascent.
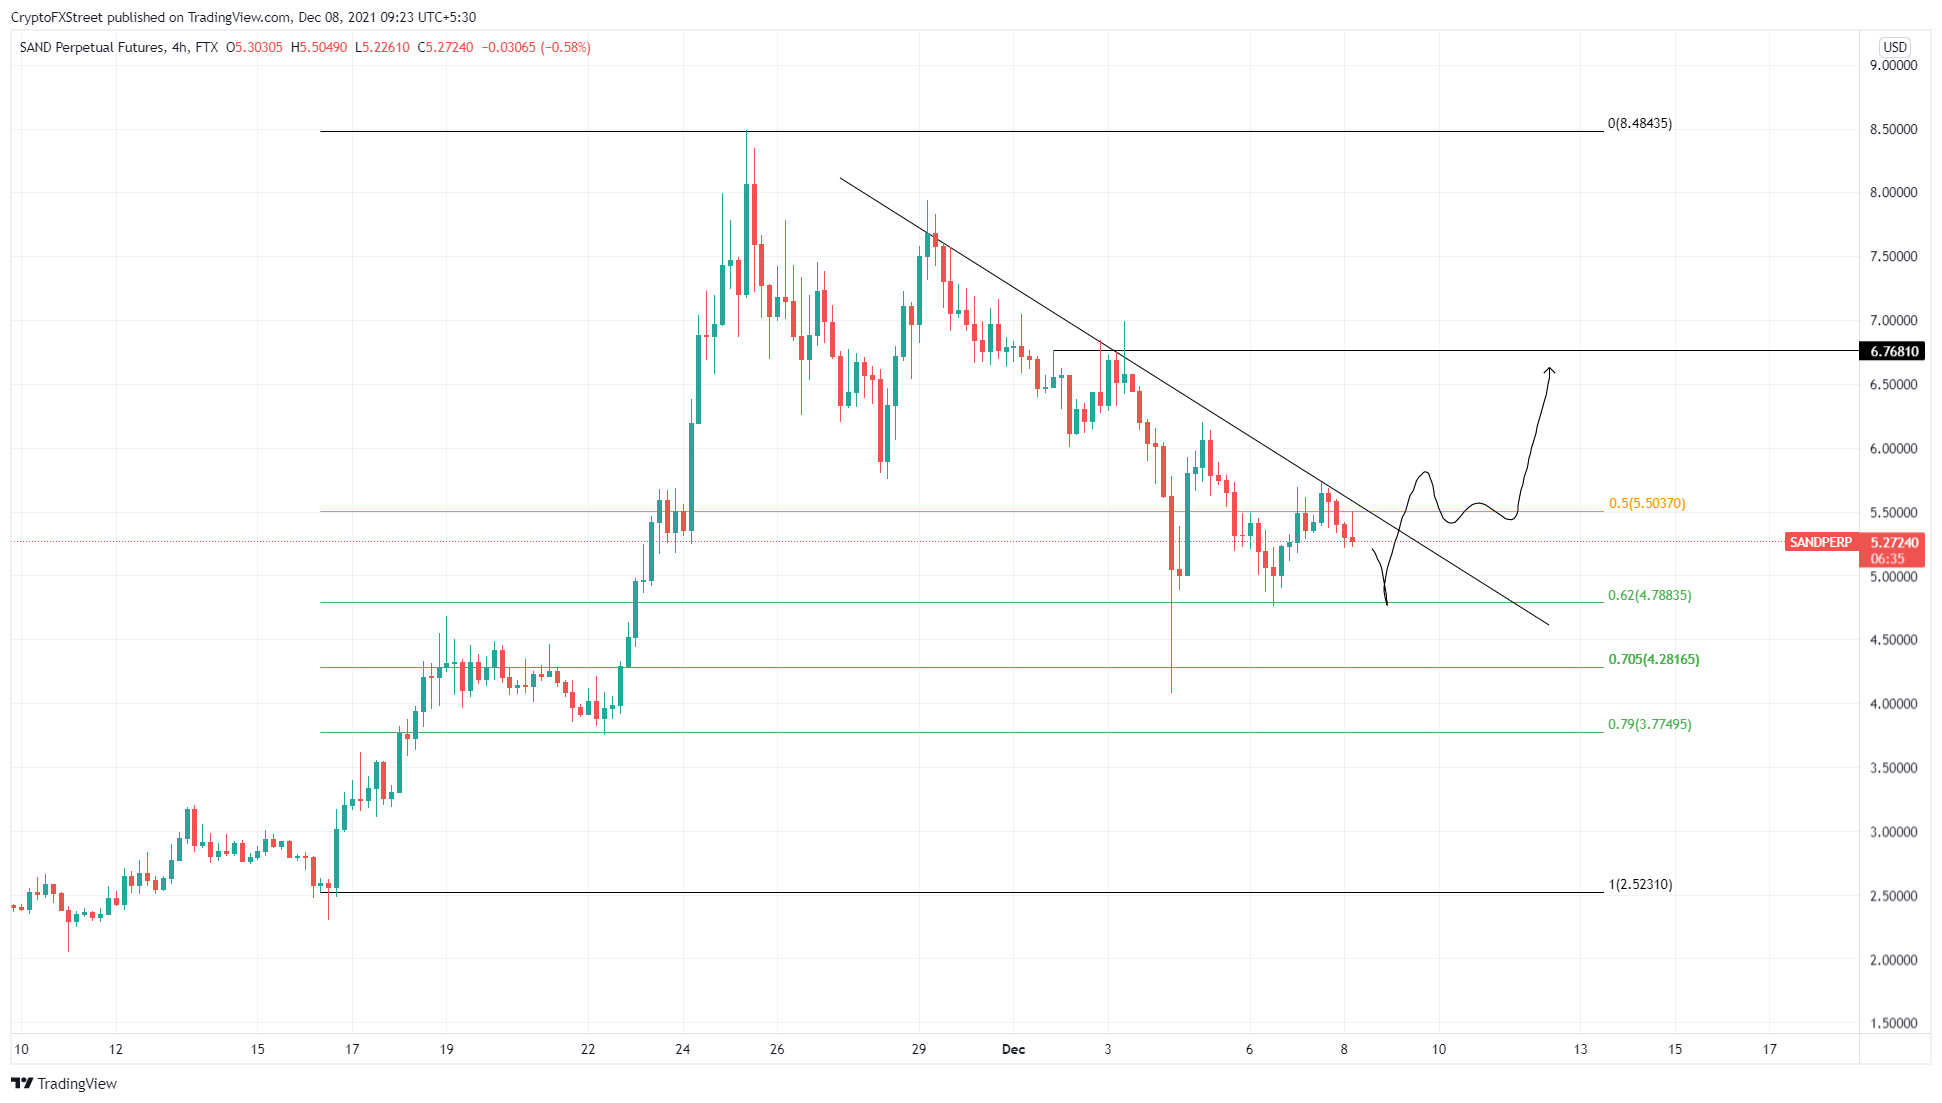
SAND/USDT 4-hour chart
Supporting this bullish outlook is Santiment’s 30-day Market Value to Realized Value (MVRV) model, which hovers around -1.7% or in the opportunity zone. This on-chain metric is used to determine the average profit/loss of investors that purchased SAND over the past month.
A negative value indicates that most of the holders are facing losses, and hence a risk of a sell-off is close to zero. Moreover, reversals usually occur after the MVRV resets or is present in the opportunity zone. This development makes the comeback of the bulls more likely.
SAND 30-day MVRV chart
While things are looking good for SAND from a technical and on-chain perspective, investors should exercise caution and beware that large transactions worth $100,000 or more have declined by 79% from 1,830 to 476 since November 24. This downfall suggests that large institutions or whales are not interested in SAND at the current price levels.
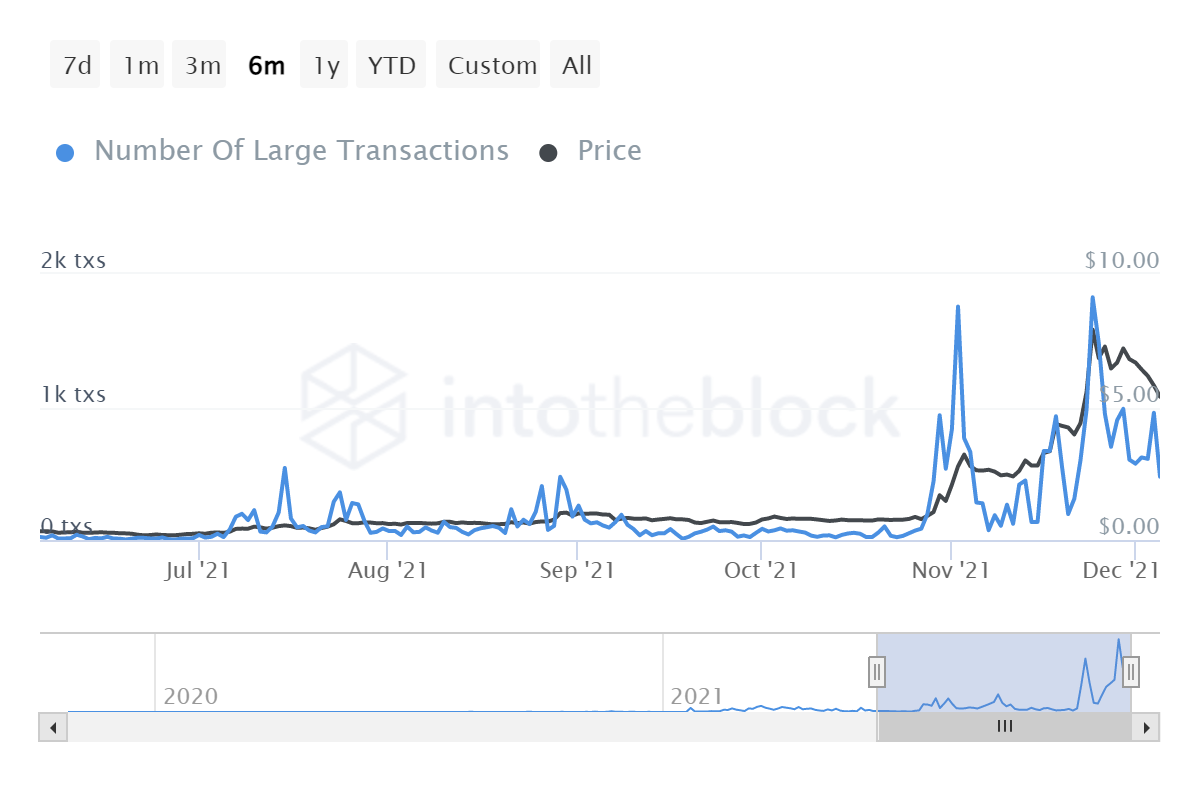
SAND large transactions
Therefore, a potential spike in selling pressure that pushes Sandbox price to produce a lower low below $3.77 will invalidate the bullish thesis. In this situation, SAND could retrace to the range low at $2.52, where it will give the uptrend another go.
Information on these pages contains forward-looking statements that involve risks and uncertainties. Markets and instruments profiled on this page are for informational purposes only and should not in any way come across as a recommendation to buy or sell in these assets. You should do your own thorough research before making any investment decisions. FXStreet does not in any way guarantee that this information is free from mistakes, errors, or material misstatements. It also does not guarantee that this information is of a timely nature. Investing in Open Markets involves a great deal of risk, including the loss of all or a portion of your investment, as well as emotional distress. All risks, losses and costs associated with investing, including total loss of principal, are your responsibility. The views and opinions expressed in this article are those of the authors and do not necessarily reflect the official policy or position of FXStreet nor its advertisers. The author will not be held responsible for information that is found at the end of links posted on this page.
If not otherwise explicitly mentioned in the body of the article, at the time of writing, the author has no position in any stock mentioned in this article and no business relationship with any company mentioned. The author has not received compensation for writing this article, other than from FXStreet.
FXStreet and the author do not provide personalized recommendations. The author makes no representations as to the accuracy, completeness, or suitability of this information. FXStreet and the author will not be liable for any errors, omissions or any losses, injuries or damages arising from this information and its display or use. Errors and omissions excepted.
The author and FXStreet are not registered investment advisors and nothing in this article is intended to be investment advice.
Recommended Content
Editors’ Picks
Solana price nears $60 after 6% rise in a day as institutions pour millions into SOL

Solana price trading at $58 is presently attempting to breach through the resistance level marked at $59. A rally is possible, given that SOL is witnessing a resurgence in bullishness. Month to date, Solana has witnessed inflows worth $40.2 million.
THORChain price climbs 15% as native RUNE secures self-custody wallet integration

THORChain (RUNE) price is pumping hard, recording a 15% addition to its market value on the day, alongside a 50% rise in trading volume. When price and trading volume rise in tandem, it often points to the asset gaining attention and therefore interest among buyers.
Up by 96% in a week, this altcoin is likely following Solana price rally from 2021

Solana was known as the “Ethereum killer” when it skyrocketed back in 2021; however, it did not manage to kill the DeFi home in any way. Similarly, many altcoins have since emerged that have been denoted as Solana killers, but hardly anyone has managed to do that.
Chainlink price readies for 10% gains as LINK staking v0.2 priority migration goes live
-637336005550289133_XtraSmall.jpg)
Chainlink (LINK) v0.2 migration has gone live, with the upgrade introducing a staking platform that ensures stakers enjoy greater flexibility. It also delivers improved security guarantees, a modular architecture, and a dynamic rewards mechanism.
Three key BTC accumulation levels before ETF approval in January 2024

Bitcoin, from a high time-frame perspective, has been in an up-only trend since the start of 2023. BTC has ignored many sell signals due to the likelihood of an Exchange-Traded Fund approval. With the holidays around the corner, falling liquidity could see BTC discounted from its current level, hovering around the $37,000 region.