Sandbox bears in control, pushing SAND price to $3
- Despite Saturday's flash-crash, sandbox price has yet to initiate a standard corrective move.
- Oscillator values and positions warn of continued selling pressure.
- A standard 50% retracement off of a parabolic rise is expected.

Sandbox price will likely follow the rest of the metaverse bubble with a more profound and violent collapse soon. A strong bounce off of crucial support may trap buyers, accelerating any selling pressure this week.
Sandbox price is in a sell-the-rally mode as a 30% drop from the weekly open is likely
Sandbox price action over the weekend was the definition of what whipsaw trading behavior looks like. Last Saturday's open was $6.01 and moved as low as $4.12 during the flash crash. An insane recovery ensued, with SAND closing positive on the day at $6.07 – one of the only cryptocurrencies to do so.
However, that didn't stop the selling pressure from continuing. Sandbox price closed lower by 11% on Sunday and has traded as low as 12% today. Unfortunately for bulls, there is zero support on the daily chart within the Ichimoku system. Near-term support doesn't appear until the weekly Tenkan-Sen at $4.57 and the Kijun-Sen at $4.33.
However, the weekly Ichimoku support levels may not hold as the oscillators remain at extremes. The Relative Strength Index is just turning south after trading above the second overbought level of 90. A likely trendline break with the Relative Strength Index points to more downside pressure.
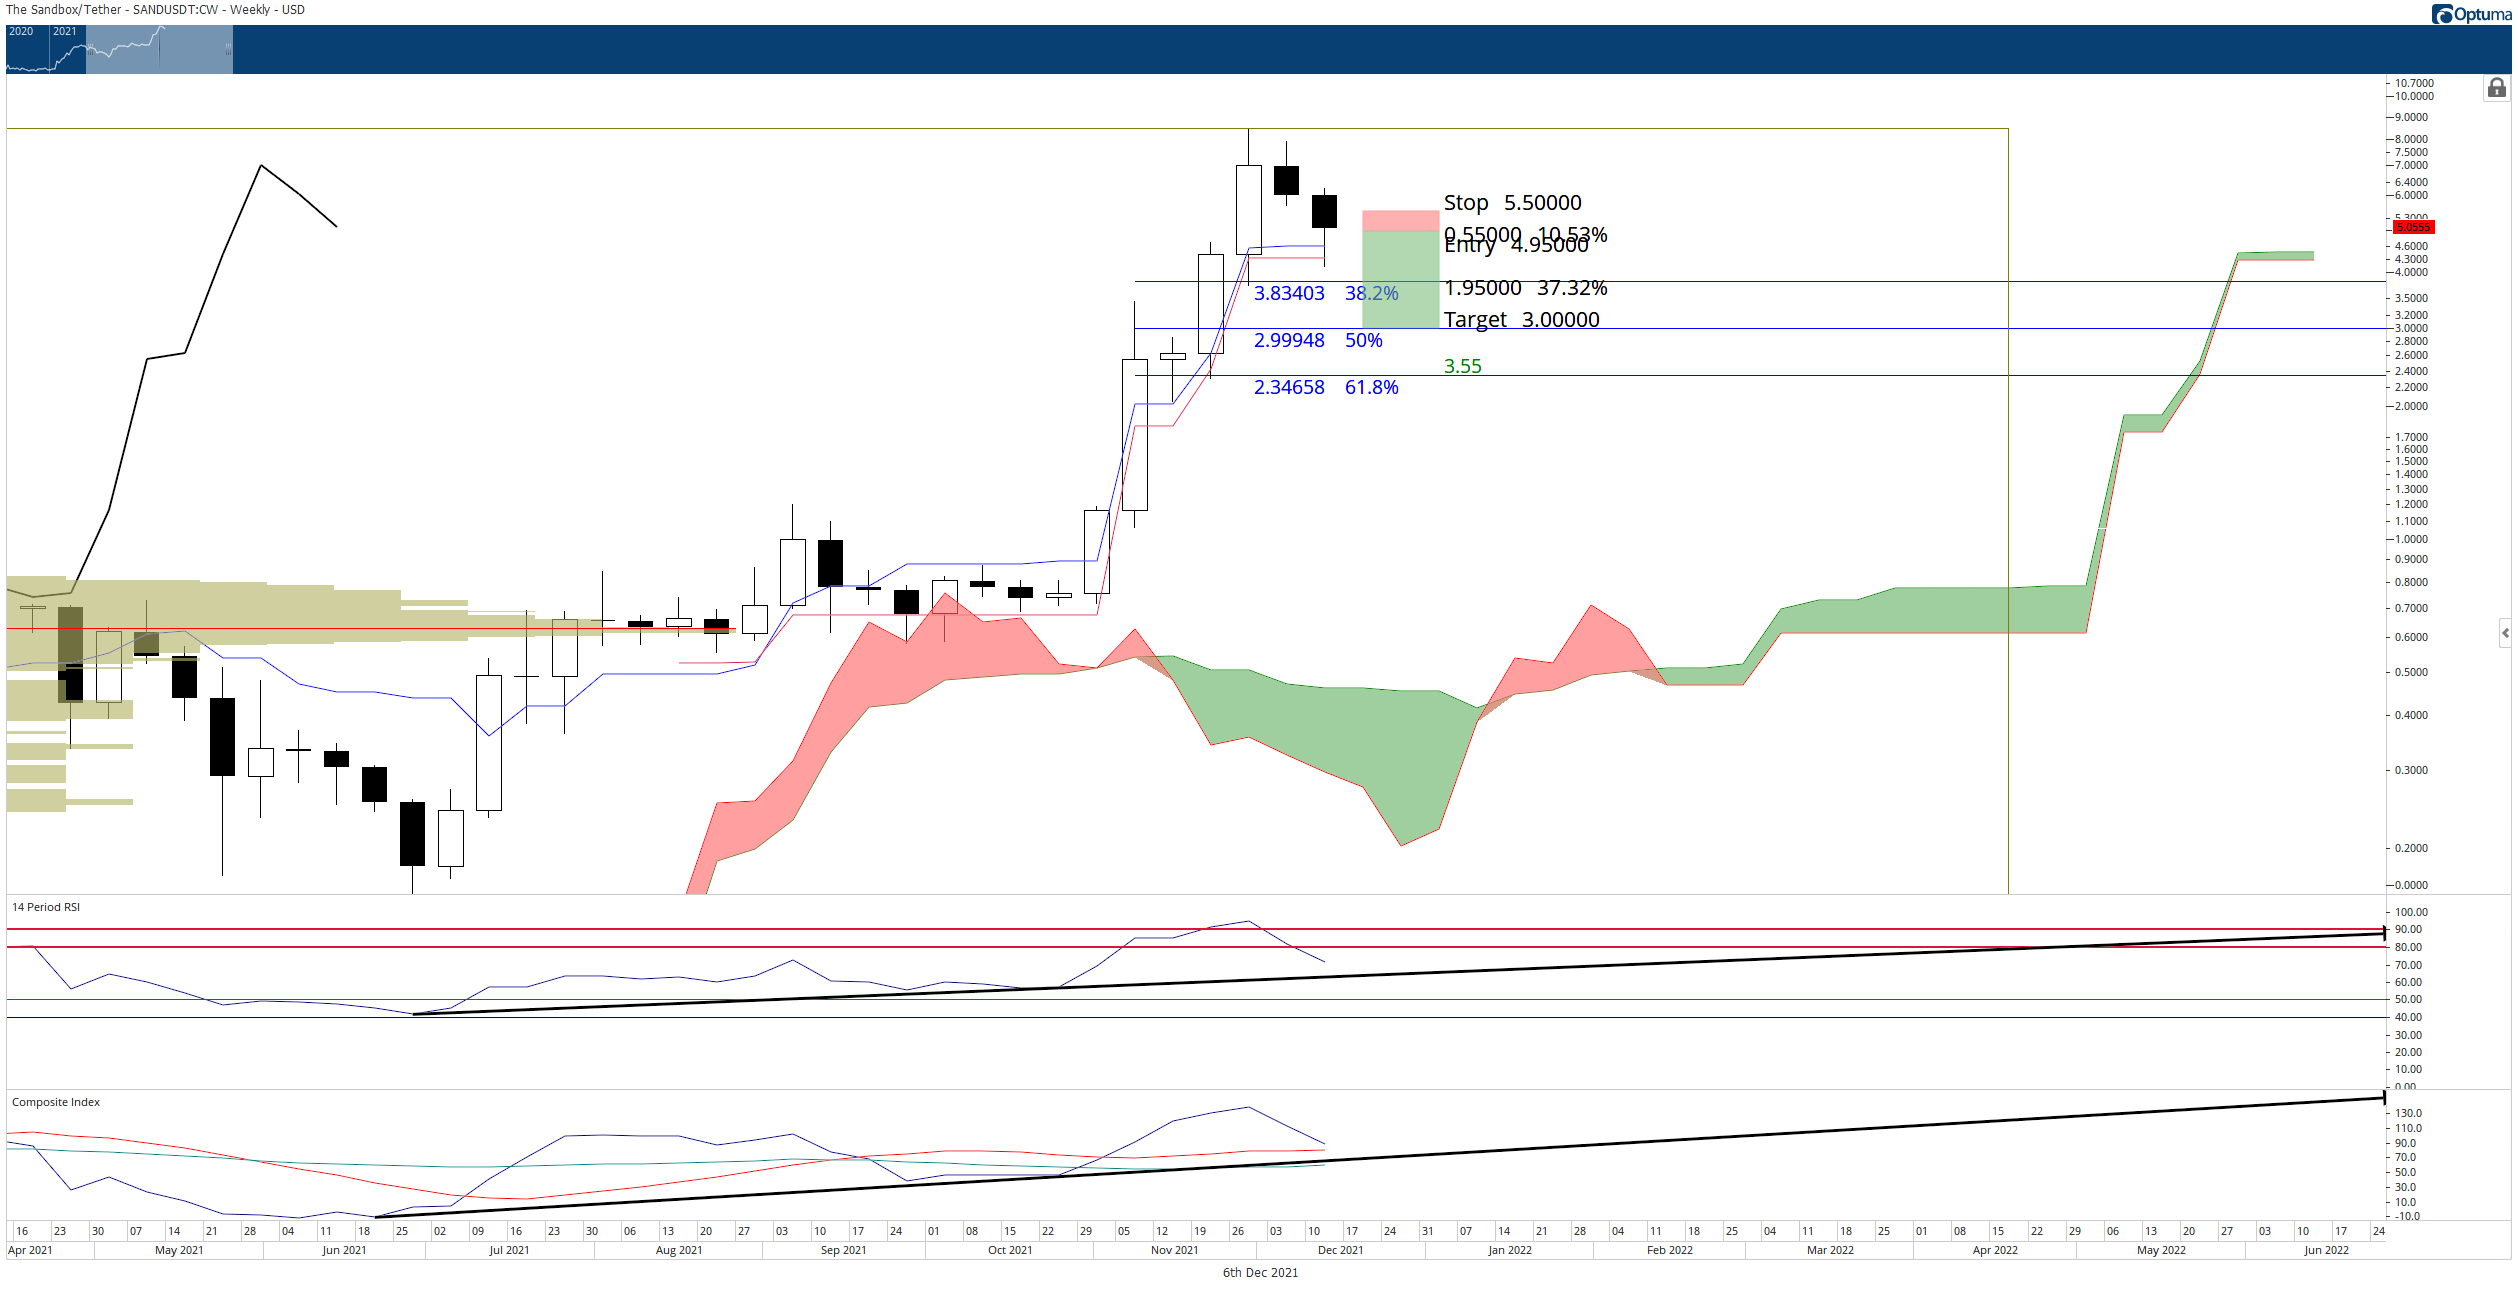
SAND/USDT Weekly Ichimoku Chart
The Composite Index is the most vital oscillator to watch. If the Composite Index crosses below its moving averages and the trendline, a swift collapse in Sandbox price is likely to occur. The projected support structure is the 50% Fibonacci retracement at $3.00.
If there is a daily or weekly close above the current week's open, that will invalidate any near-term bearish outlook.
Author

Jonathan Morgan
Independent Analyst
Jonathan has been working as an Independent future, forex, and cryptocurrency trader and analyst for 8 years. He also has been writing for the past 5 years.


