Sandbox price likely to surge 15% as SAND dips into crucial support level
- Sandbox price is preparing for a quick reversal as it bounces off the $4.43 to $4.81 demand zone.
- Investors can expect a 15% run-up to $5.52 that could extend to $6 or higher if buying pressure persists.
- A breakdown of the demand zone’s lower limit at $4.43 could invalidate the bullish thesis.

Sandbox price presents a good trading opportunity after the recent flash crash on January 5. The downswing has knocked SAND to dip into a crucial support level that could serve as a platform for further uptrend.
Sandbox price ready for recovery
Sandbox price has seen a considerable descent from its all-time high at $8.48 on November 24, 2021. The resulting pullback has stabilized around the $4.81 support level over the past month, and the January 5 crash has also bounced off the same barrier.
Interestingly, the demand zone, extending $4.43 to $4.81, coincides with the aforementioned support barrier. Therefore, investors can open a long position for SAND at the retest of the $4.43 and expect the Sandbox price to trigger a 15% run-up to $5.52.
If the bulls go on a stampede, SAND could slice through the said resistance barrier and make its way to $6, representing a 25% ascent from the demand zone. Holders can take profits at either of these levels.
In a highly bullish case, the SAND price could climb higher to sweep the buy-stop liquidity resting above $7.
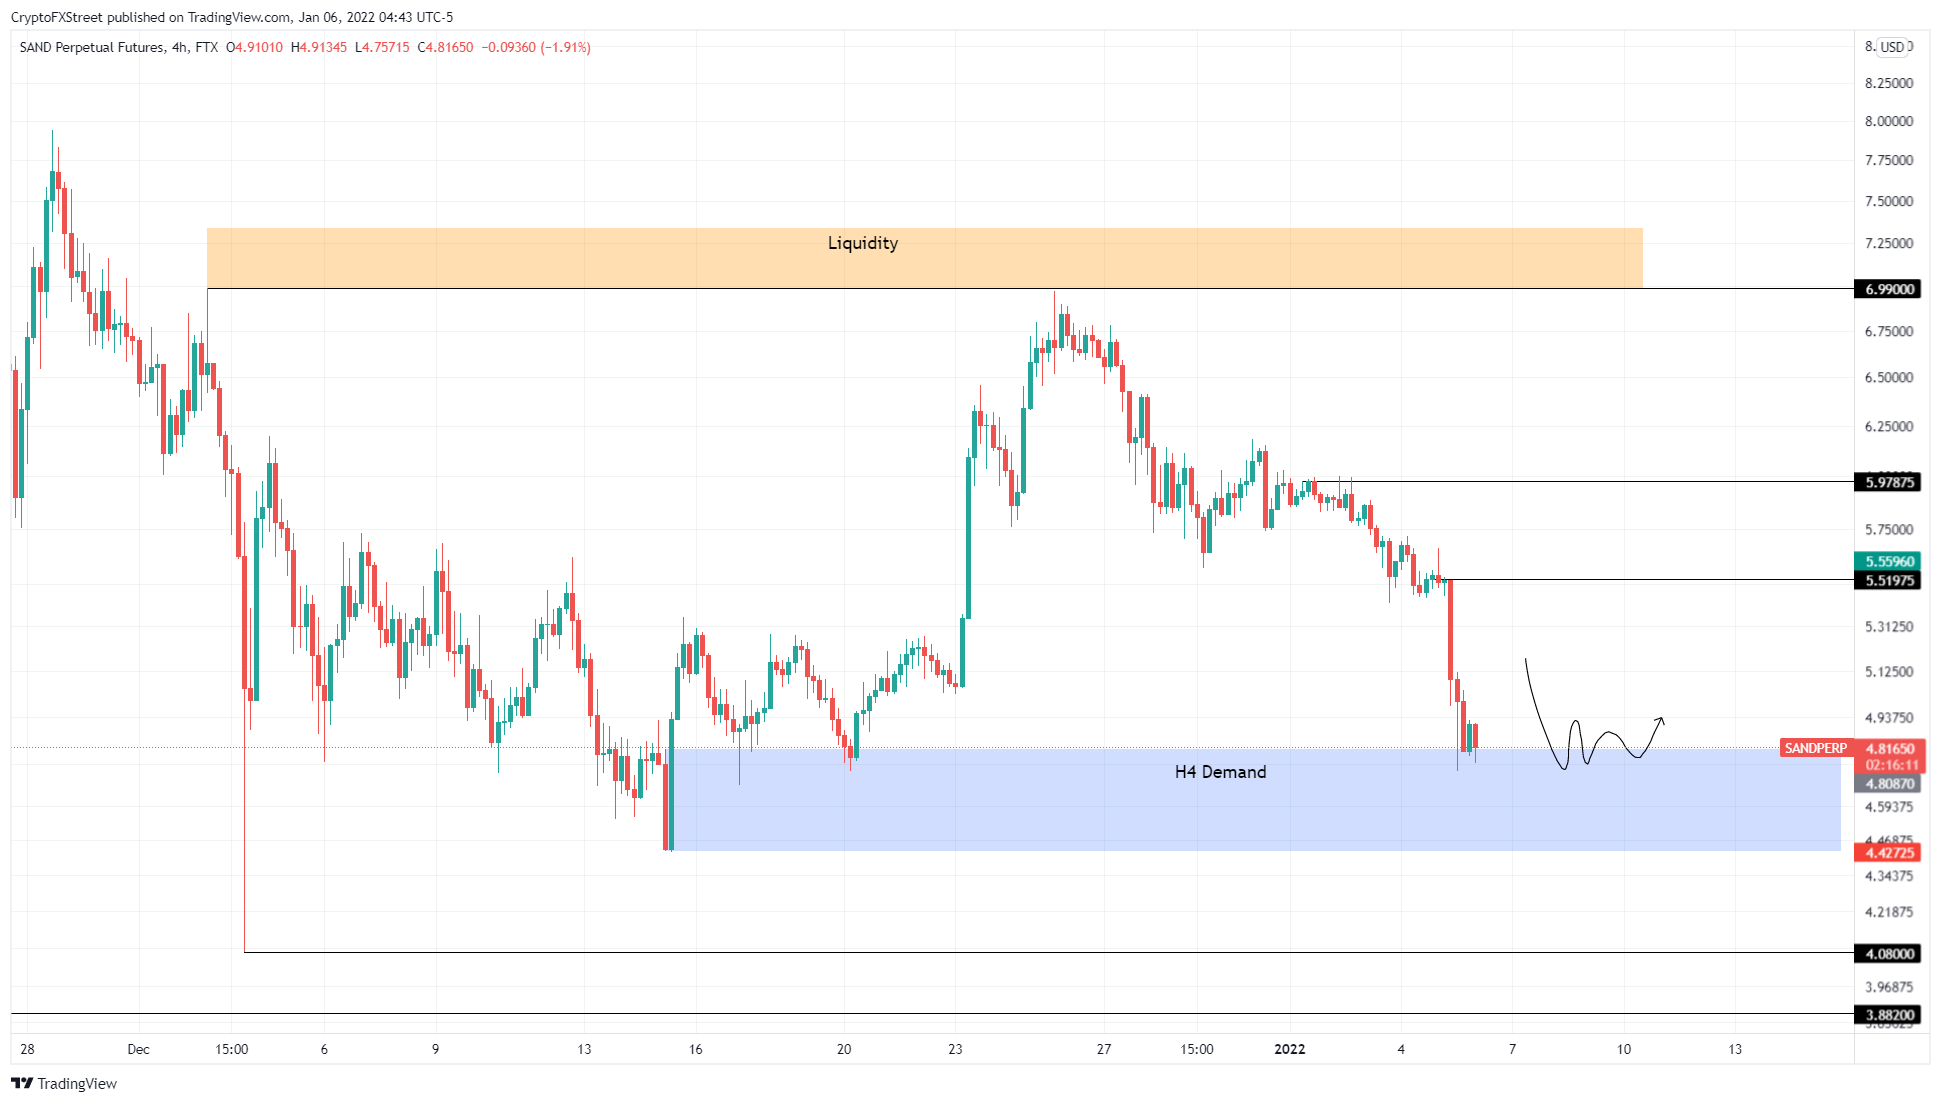
SAND/USDT 4-hour chart
On the other hand, the bullish thesis Sandbox price will face invalidation if the selling pressure pushes SAND to produce a four-hour candlestick close below $4.43. This development will set a lower low, hinting at a potential shift in a trend that favors bears. Investors can place their stop losses just below the said level.
Such a situation could worsen, crashing Sandbox price to the immediate support levels at $4.08 or $3.88.
Author

Akash Girimath
FXStreet
Akash Girimath is a Mechanical Engineer interested in the chaos of the financial markets. Trying to make sense of this convoluted yet fascinating space, he switched his engineering job to become a crypto reporter and analyst.



