- Sandbox price is preparing for a major rally to set a new record high.
- If the bullish chart pattern is robust, a 38% surge could be on the radar.
- A slice above $6.96 could unlock significant gains for SAND.
Sandbox price is forming a bullish chart pattern that could send SAND surging 38% toward $9.60. As long as the token manages to stay above the December 30 low at $5.55, the optimistic target could still be in the offing.
Sandbox price set sights on $9.60 next
Sandbox price is forming a cup-and-handle chart pattern on the 12-hour chart, projecting a 38% ascent toward $9.60 from the neckline at $6.96.
Sandbox price will face immediate resistance at the 50% retracement level at $6.07, then at the 61.8% Fibonacci retracement level at $6.53. The toughest obstacle for SAND to overcome is the neckline of the governing technical pattern at $6.96.
If Sandbox price manages to slice above the upper boundary of the prevailing chart pattern, the 38% climb could be on the radar. SAND will face an additional hurdle at the 78.6% Fibonacci retracement level, coinciding with the resistance line given by the Momentum Reversal Indicator (MRI) at $7.20.
Sandbox price must also tackle the November 29 high at $7.93, then the November 25 high at $8.51 next. The 127.2% Fibonacci extension level would then act as a headwind for SAND at $9.11 before the aforementioned optimistic target could be reached.
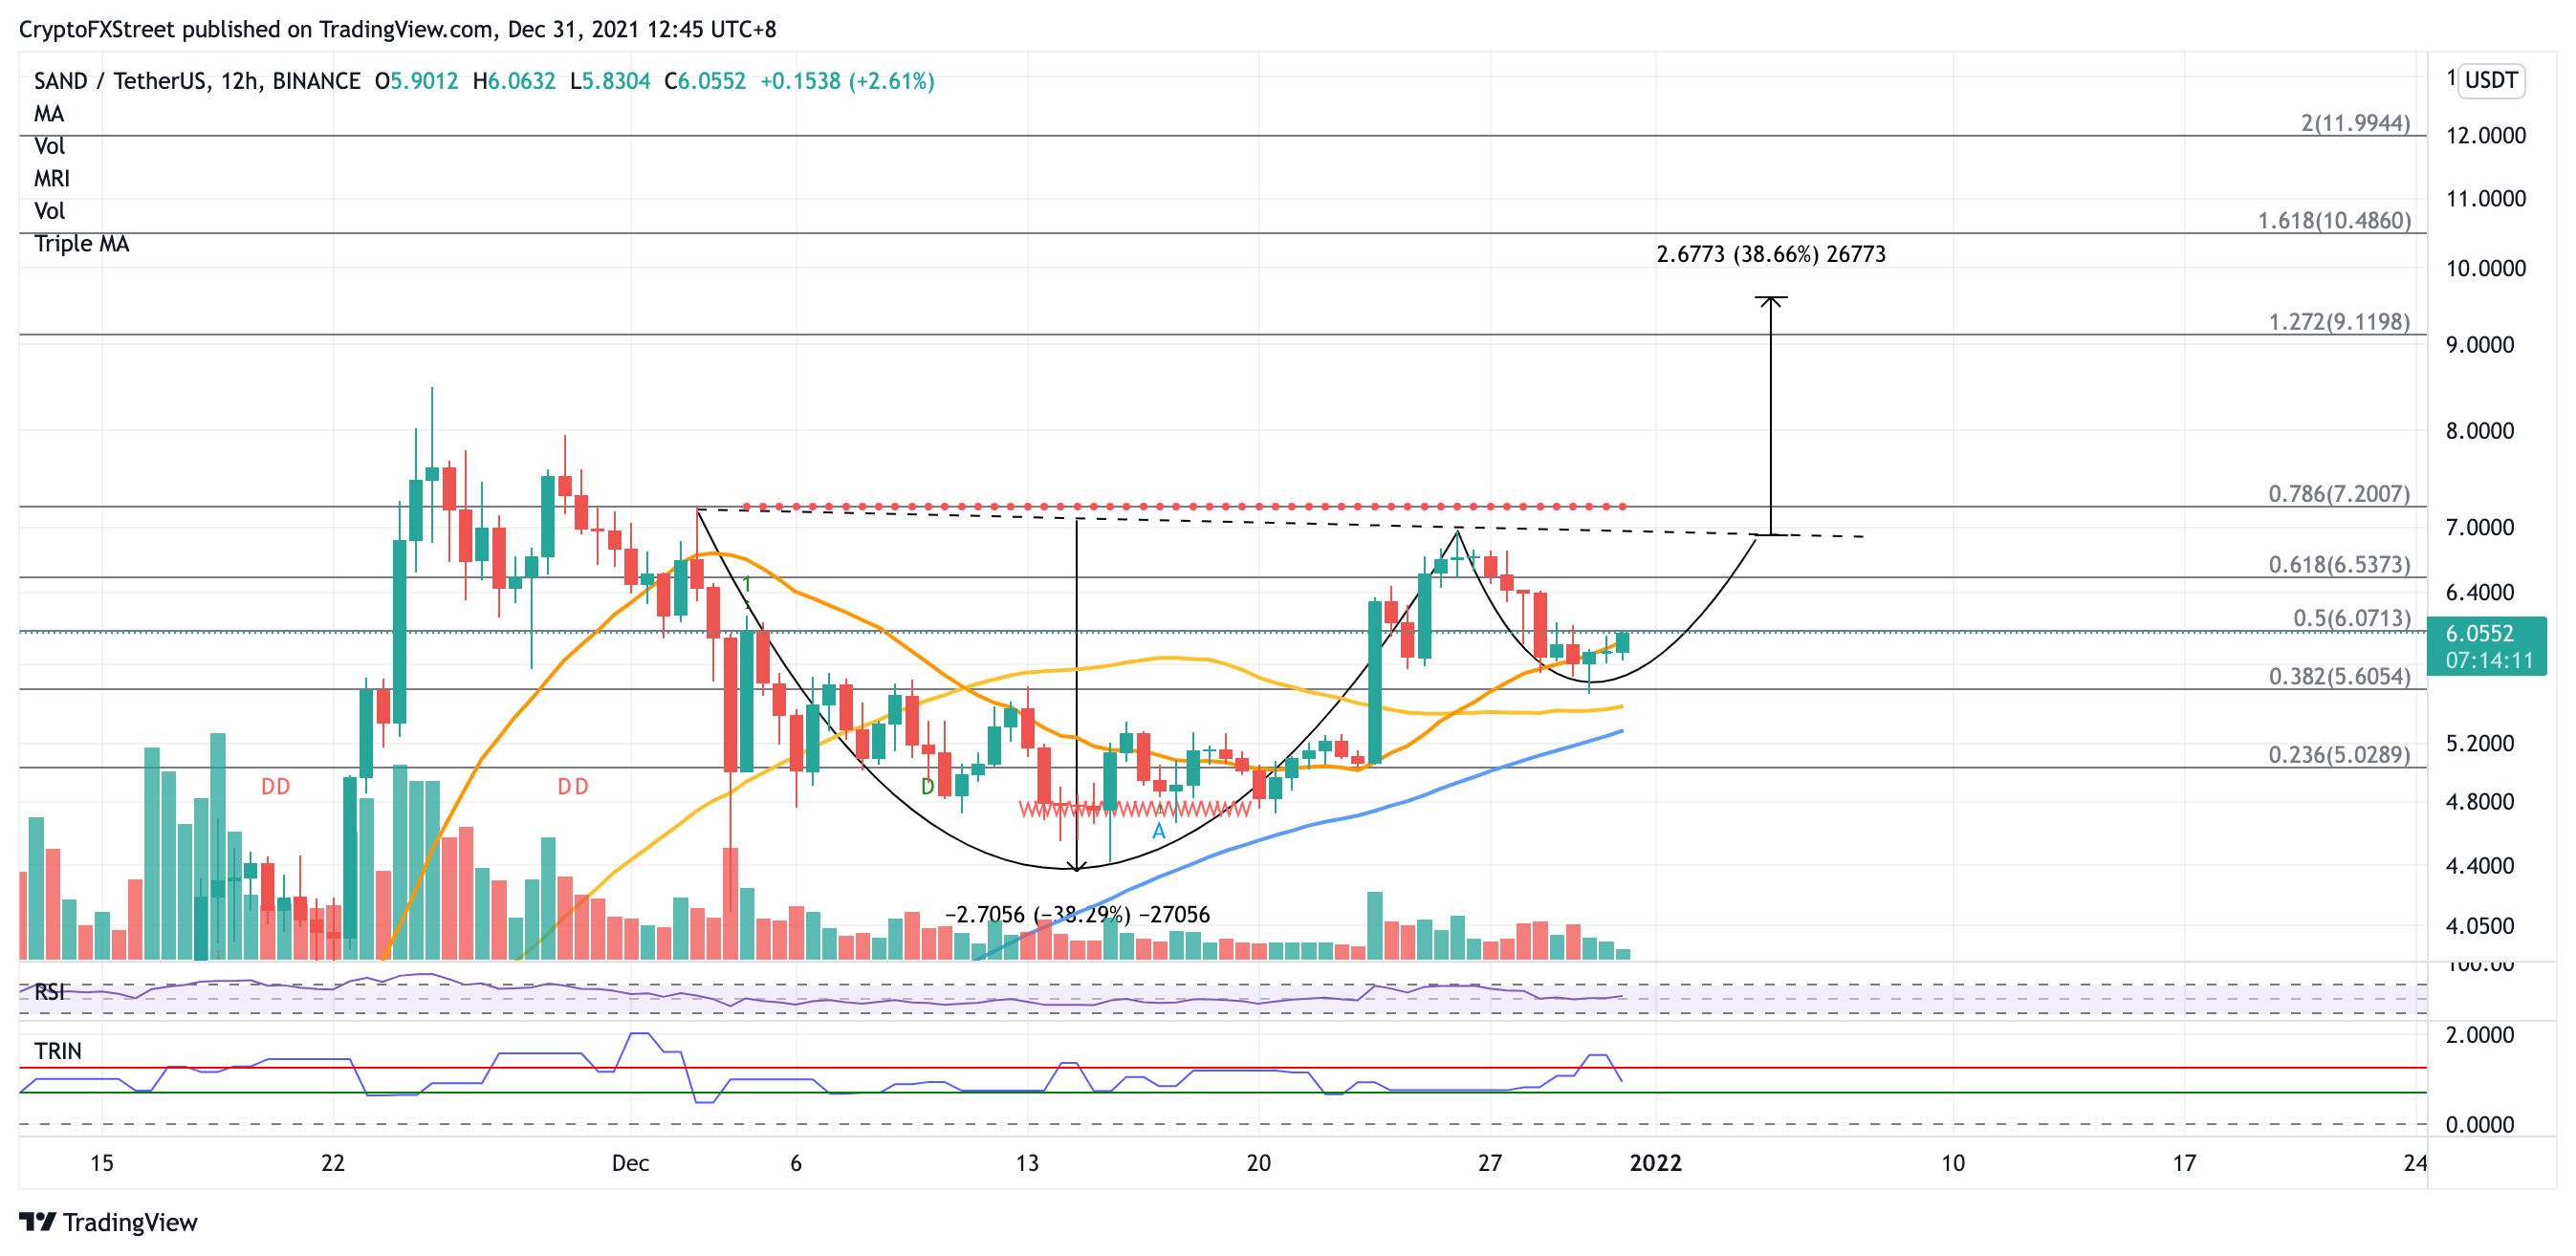
SAND/USDT 12-hour chart
If a spike in sell orders occurs, Sandbox price will slide toward the nearest support at the 21 twelve-hour Simple Moving Average (SMA) at $5.97. An additional line of defense may emerge at the December 30 low at $5.55. However, investors should note that if SAND falls below the aforementioned foothold, the bullish outlook would be invalidated.
Sandbox price could then slide further to discover support at the 38.2% Fibonacci retracement level at $5.60, then at the 50 twelve-hour SMA at $5.45, then at the 100 twelve-hour SMA at $5.27.
Note: All information on this page is subject to change. The use of this website constitutes acceptance of our user agreement. Please read our privacy policy and legal disclaimer. Opinions expressed at FXstreet.com are those of the individual authors and do not necessarily represent the opinion of FXstreet.com or its management. Risk Disclosure: Trading foreign exchange on margin carries a high level of risk, and may not be suitable for all investors. The high degree of leverage can work against you as well as for you. Before deciding to invest in foreign exchange you should carefully consider your investment objectives, level of experience, and risk appetite. The possibility exists that you could sustain a loss of some or all of your initial investment and therefore you should not invest money that you cannot afford to lose. You should be aware of all the risks associated with foreign exchange trading, and seek advice from an independent financial advisor if you have any doubts.
Recommended Content
Editors’ Picks
Week Ahead: Altcoin plays for traders as Bitcoin crosses $42,000

Bitcoin price hit $40,000 over the weekend as investors anticipate a spot BTC ETF approval in January. Bitcoin trades around $42,000 and shows no signs of stopping. This article will focus on what to expect this week and the outlook for BTC and if the fourth cycle is any different.
Crypto exchanges serving Indian residents to comply with Anti-Money Laundering guidelines: Indian Parliament

Crypto exchanges serving Indian residents to face action if not compliant with Anti-Money Laundering and Countering of Financial Terrorism guidelines.The process of registering offshore exchanges, Virtual Digital Asset service providers has been initiated.
Dogecoin breaks key $0.088 barrier ahead of tenth birthday, 87% DOGE holders at profit

As Dogecoin (DOGE) approaches its tenth anniversary on Wednesday, the Shiba-Inu-themed meme cryptocurrency has surpassed a crucial resistance level at $0.088076, reaching the highest level since mid-April.
Bitcoin price could rally to $45,000 ahead of BTC halving event in April 2024

Bitcoin price crossed the $41,000 mark on Binance, in its ongoing uptrend. BTC price rally is likely driven by the anticipation of Spot Bitcoin ETF approval. There are more catalysts driving BTC price gains in the current cycle.
Analyzing potential $30k corrections ahead of BTC ETF approval

Bitcoin has slowed down its 2023 bull rally as it approaches the $37,000 level. After three weeks of consolidating around this level, BTC shows no directional bias whatsoever. Some investors speculate this could be an upward-sloping accumulation that leads to a $40,000 rally.