SafeMoon price nears lift-off, as SAFEMOON possesses the conditions for a big move
- SafeMoon price is nearing the apex of a descending triangle pattern, suggesting a pattern resolution soon.
- Bollinger Band Width (BBW) has contracted further, also indicating that a notable move is immediate.
- SAFEMOON does not show a weekly return of note since the end of April, confirming the recent challenges on the long side.

Safemoon price has been coiling within a descending triangle pattern since the May crash, highlighted by no sustainable rallies and continuous support along the May 19 low of $0.00000261. The downward trajectory has kept SAFEMOON investors on the defensive. However, in the context of tightening price traction enforced by the triangle pattern and emphasized by the notable contraction of the Bollinger Bands, combined with a nearing apex, SafeMoon price is poised for a substantive move soon, either way.
SafeMoon price has impressive potential yet to be developed
Based on the current SAFEMOON descending triangle pattern, the measured move is 57%, projecting a downside price target of $0.00000111. To activate the pattern, SafeMoon price needs to log a daily close below the May 19 low of $0.00000261, something the digital token failed to achieve on June 22, July 19, July 20, and so far during today's test.
The upside measured move price target is $0.000000499. A breakout is recorded when SAFEMOON can best the 20-day simple moving average (SMA) at $0.00000295 and then chart a daily close above the triangle’s upper resistance line at $0.00000318. The ideal scenario is for SafeMoon price to close the breakout day above the 50-day SMA at $0.00000349, enabling the cryptocurrency to rally unfettered to the measured move target and a test of the June 16 high, at $0.00000500.
Regarding the timing of the 57% move, the contracting SafeMoon price and as a result, the Bollinger Bands have pressed the BBW to the lowest reading since April, proposing an imminent release from the descending triangle pattern. Strengthening the timeliness of the scenario is that SAFEMOON now is beyond 80% of the distance between the triangle’s base and apex. Any further coiling to the apex will diminish the robustness of the eventual breakout.
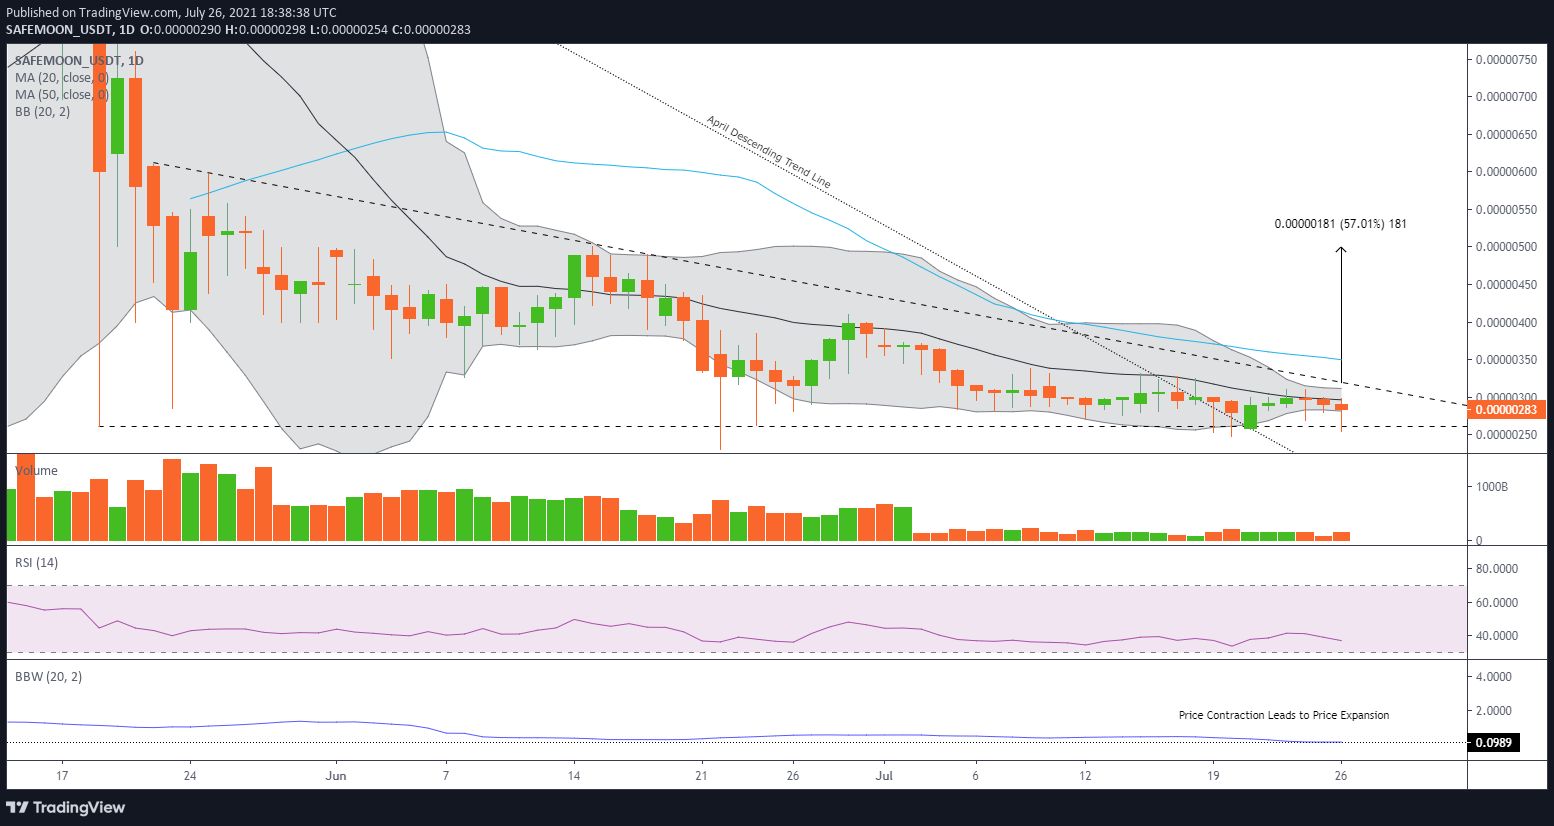
SAFEMOON/USD daily chart
In the case of a throwback, use the SAFEMOON triangle’s horizontal support line as a stop on a daily closing basis. Alternatively, use the triangle’s resistance line as a stop on a daily closing basis for pullbacks.
The final SafeMoon price direction is unknown, but the degree of price contraction points to a significant move following the triangle pattern’s resolution. Historical probabilities do indicate it will be to the downside. Nevertheless, SAFEMOON market operators should be prepared for both scenarios with precise, programmed alerts to maximize a quick burst higher or lower.
Author

Sheldon McIntyre, CMT
Independent Analyst
Sheldon has 24 years of investment experience holding various positions in companies based in the United States and Chile. His core competencies include BRIC and G-10 equity markets, swing and position trading and technical analysis.


