SafeMoon Price Forecast: SAFEMOON may be on the cusp of a 50% decline
- SafeMoon price is shaping an unorthodox head-and-shoulders topping pattern.
- 4-hour Ichimoku Cloud providing stable support since May 10.
- A token with significant interest but no clear use cases, other than going to the moon.

SafeMoon price rests on important short-term support, but the developing pattern targets a significant decline in the coming hours and days.
SafeMoon price volatility preys on the unsophisticated investor
For the unaware, SAFEMOON is a new cryptocurrency that began trading in March 2021. The digital token began trading at $0.000000001 and with a tiny market capitalization. According to Bitmart, SafeMoon price catapulted to $0.000015 by April 20, yielding a tremendous return for brave investors. However, it followed the giant rally with a 90% decline into April 21.
SAFEMOON has a maximum supply of 10 quadrillion tokens but only has 600 billion in circulation. It is a deflationary currency, as supply declines over time. Still, some have called it a pyramid scheme because sellers of the token are charged a 10% fee, with 5% of the fee being burned and the other 5% distributed to SAFEMOON investors. Investors are dependent on more people buying SAFEMOON to increase their investment.
On the 4-hour chart, SafeMoon price is flashing a head-and-shoulders topping pattern that began on May 6. It has nearly completed the right shoulder and has defined a timely entry point. The measured move target of the topping pattern is $0.00000462, a loss of over 45% from the current position of the neckline and 50% from price at the time of writing.
To activate the pattern, SafeMoon price will need to break through the Ichimoku cloud support that envelops the neckline. The cloud provided support from May 10 to May 14, acknowledging its importance in determining the eventual resolution of the pattern.
Suppose SafeMoon price does collapse below the neckline and Ichimoku cloud. In that case, SAFEMOON will discover support at the 200 four-hour moving average at $0.0000063318 before finally reaching at least the measured move target of $0.00000462.
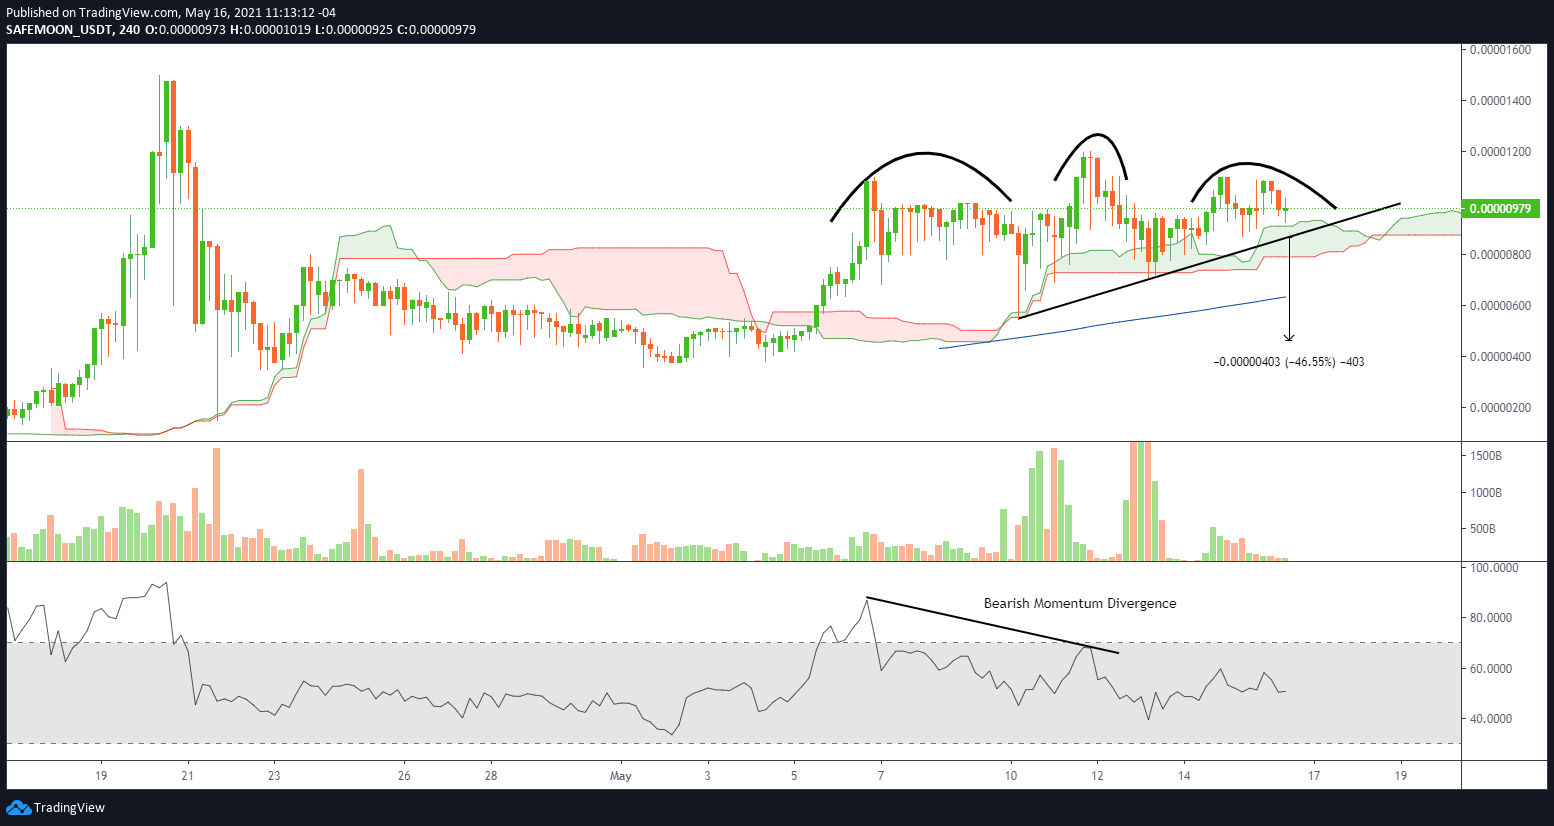
SAFEMOON/USDT 4-hour chart
The bearish outlook for SAFEMOON is voided if SafeMoon price rallies above the right shoulder at $0.000011. The first level of resistance for a potential new rally is the pattern’s head at $0.000012.
Author

Sheldon McIntyre, CMT
Independent Analyst
Sheldon has 24 years of investment experience holding various positions in companies based in the United States and Chile. His core competencies include BRIC and G-10 equity markets, swing and position trading and technical analysis.


