- SafeMoon price has been forming a falling wedge pattern since May 20.
- SAFEMOON broke out of this bullish pattern, confirming a 77% rally to $0.00000377.
- A decisive close below $0.00000157 will invalidate the bullish thesis.
SafeMoon price was consolidating inside a bullish pattern. However, recently, this pattern was breached toward the upside, indicating a bullish breakout confirmation. Going forward, investors can expect this uptrend to continue.
SafeMoon price kick-starts a bullish move
SafeMoon price has been setting up higher lows and lower lows since May 20. By connecting these swing points using trend lines, a falling wedge pattern forms.
This bullish setup forecasts a 77% upswing, determined by measuring the distance between the first swing high and swing low. Adding this distance to the breakout point at $0.00000212 reveals a target of $0.00000377.
As of August 6, SafeMoon price breached the upper trend line, indicating a breakout. Therefore, investors need to pay close attention to the resistance levels that are present between the current position and the forecasted target at $0.00000377.
In some cases, the uptrend might be halted by the ceiling at $0.00000264 since it served as a crucial support level before it was breached on July 19.
Therefore, confirmation of the upswing will arrive after SafeMoon price shatters $0.00000264.
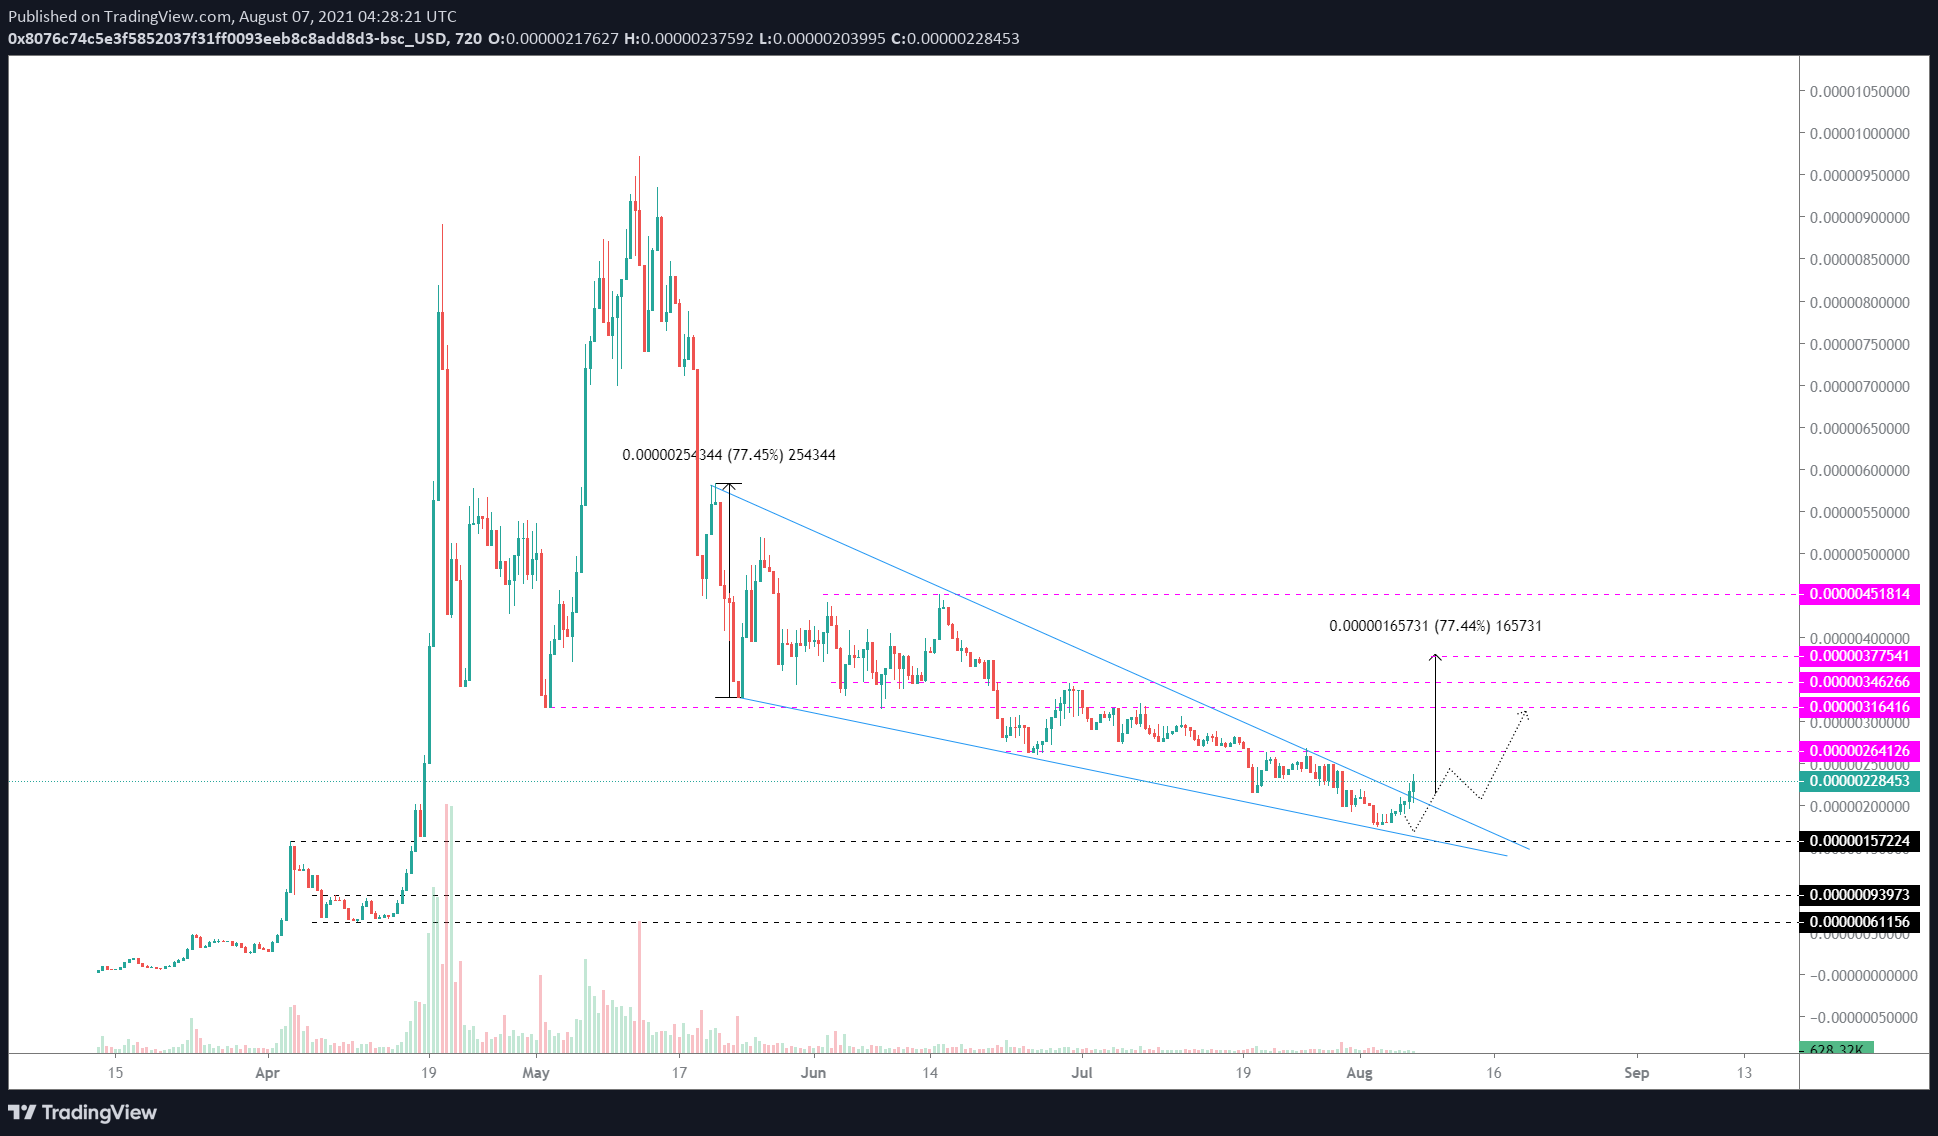
SAFEMOON/USDT 12-hour chart
While things seem bullish for SafeMoon price, a potential spike in selling pressure that pushes the altcoin back into the falling wedge pattern will indicate a weakness among buyers.
If this downswing slices through the lower trend line, the trend will likely shift towards the bears.
A breakdown of the $0.00000157 support level will invalidate the bullish thesis and, in some cases, open the path to retest the $0.000000940 demand barrier.
Information on these pages contains forward-looking statements that involve risks and uncertainties. Markets and instruments profiled on this page are for informational purposes only and should not in any way come across as a recommendation to buy or sell in these assets. You should do your own thorough research before making any investment decisions. FXStreet does not in any way guarantee that this information is free from mistakes, errors, or material misstatements. It also does not guarantee that this information is of a timely nature. Investing in Open Markets involves a great deal of risk, including the loss of all or a portion of your investment, as well as emotional distress. All risks, losses and costs associated with investing, including total loss of principal, are your responsibility. The views and opinions expressed in this article are those of the authors and do not necessarily reflect the official policy or position of FXStreet nor its advertisers. The author will not be held responsible for information that is found at the end of links posted on this page.
If not otherwise explicitly mentioned in the body of the article, at the time of writing, the author has no position in any stock mentioned in this article and no business relationship with any company mentioned. The author has not received compensation for writing this article, other than from FXStreet.
FXStreet and the author do not provide personalized recommendations. The author makes no representations as to the accuracy, completeness, or suitability of this information. FXStreet and the author will not be liable for any errors, omissions or any losses, injuries or damages arising from this information and its display or use. Errors and omissions excepted.
The author and FXStreet are not registered investment advisors and nothing in this article is intended to be investment advice.
Recommended Content
Editors’ Picks
Ripple's move above this key level could trigger nearly 50% rally for XRP
Ripple has overcome a critical resistance level and flipped into a support floor on the weekly time frame. This development happened while XRP tightly consolidated for roughly 250 days. Investors can expect XRP to kickstart a massive rally.
Optimism price outlook with nearly $90 million worth of OP tokens flooding markets on Friday
Optimism volatility has shrunk in the ours leading to the network’s cliff unlock. It joins the likes of dYdX and Sui, which have similar events on their calendars. As token unlocks are often considered bearish catalysts, investors should brace for a reaction after the event.
Top 3 Price Prediction Bitcoin, Ethereum, Ripple: Retail watches from the sidelines with a bias for shorts
Bitcoin could clear $73,777 peak as BTC bulls resurface. Ethereum might fall 10% before next leg up as ETH RSI teases with sell signal. XRP could lose $0.6000 threshold as Ripple bulls fail to show up.
Jito price could hit $6 as JTO coils up inside this bullish pattern
Jito price action shows a potential cup and handle formation. Based on theoretical measurement rules, a successful breakout could yield a 56% rally to $6.0. A breakdown of the $3.86 support level would create a lower low for JTO and invalidate the bullish thesis.
Bitcoin: BTC may have recovered, but is it out of the woods?
Bitcoin’s (BTC) upward momentum has shown a significant decline for the past two weeks or so. This development led to a bearish signal on the weekly and an uncertain outlook on the monthly.