Ripple Price Prediction: XRP technicals turn massively bearish, as declines to $0.45 beckon
- Ripple is fighting tooth and nail to stay above the 50 SMA as declines to $0.45 linger.
- XRP/USD bearish outlook was validated following a breakdown under the ascending wedge pattern.

Ripple has not gathered enough strength to overcome the resistance at $0.7 despite displaying a robust bullish front in the last seven days. The cross-border token is on the cusp of a massive breakdown, especially if the price slides under a crucial short term anchor.
Ripple's possible breakdown eyes $0.45
XRP has recently broken below a critical ascending wedge pattern. Generally, these types of wedges are used in technical analysis to signal potential reversals after long uptrends. For instance, XRP recovered significantly from last week's support at $0.45 but could not break the seller congestion at $0.7.
As bears swing into action, bullish pressure decreases by a large margin, hence the pattern's breakdown. For now, Ripple is trading at $0.61 while holding at the 50 Simple Moving Average (SMA).
The cross-border token is likely to resume the downtrend if losses extend under the moving average. A glance at the chart highlights the next vital support area between $0.45 and $0.50, as reinforced by the 100 SMA.
%20(13)-637424742631589267.png)
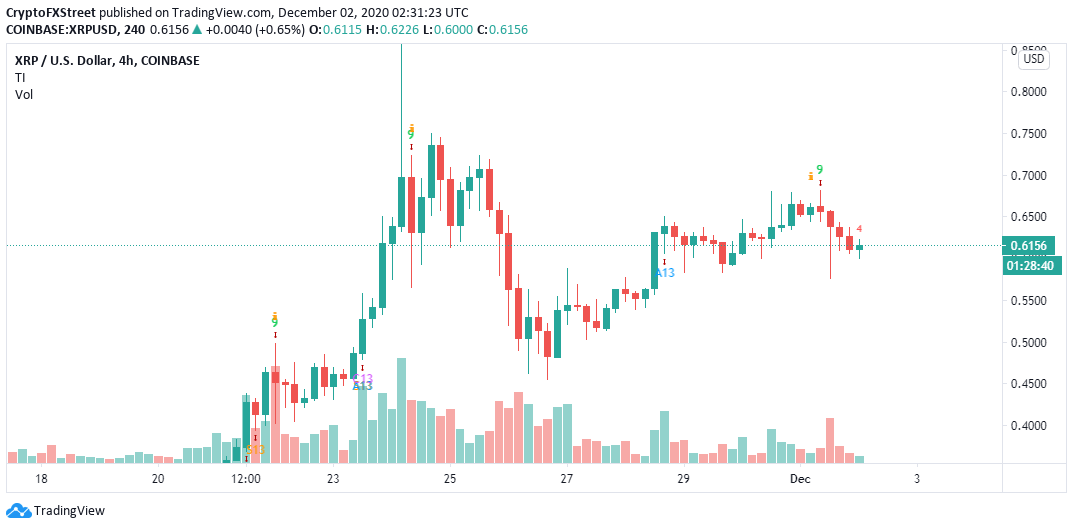
XRP/USD 4-hour chart
The bearish narrative has been emphasized by the downward trending Moving Average Convergence Divergence. A bearish divergence under the MACD shows that XRP is gradually falling into the hands of the sellers.
The TD Sequential indicator recently presented a sell signal in the same 4-hour timeframe. The call manifested a green nine candlestick. If the critical support mentioned earlier at the 50 SMA caves, the sell signal's impact might continue to push XRP to more losses. In case supply for Ripple rises, a significant downtrend may come into the picture in the near term.
XRP/USD 4-hour chart
On the other hand, XRP might renew the uptrend and commence on the journey of breaking barriers toward $0.1, especially if the price makes a daily close above the 50 SMA. Trading above the critical hurdle at $0.7 will also give credibility to the bullish outlook.
Author

John Isige
FXStreet
John Isige is a seasoned cryptocurrency journalist and markets analyst committed to delivering high-quality, actionable insights tailored to traders, investors, and crypto enthusiasts. He enjoys deep dives into emerging Web3 tren


