Ripple Price Prediction: XRP readies for the ultimate liftoff to $0.3
- Ripple is seeking support, preferably at the 100 SMA after rejection from $0.26.
- A buy signal by the TD Sequential indicator awaits validation even as whales consistently accumulate XRP.

The cross-border token has recently hit a wall at $0.26. The barrier came after XRP found support at $0.22 and recovered steadily. However, the bullish narrative to $0.3 has been delayed by the seller congestion at $0.26.
Meanwhile, XRP/USD is doddering at $0.245 amid a developing bearish momentum. Probably, buyers feel exhausted due to the several rejections suffered at $0.26. However, XRP is accorded with immense support, likely to absorb the selling pressure.
Ripple’s Swell 2020 held virtually
The Swell conference organized by Ripple is being conducted online this year due to the COVID-19 pandemic. Ripple’s CEO, Brad Garlinghouse, opened the conference on October 14, saying that the cross-border remittance company plans to expand RippleNet.
Prominent speakers are expected to grace the event, including key figures from the blockchain and fintech industries, as well as the World Bank. In the past, XRP has rallied during or after the Swell conference, but for now, trading remains lethargic.
Ripple recovery to $0.3 in the offing
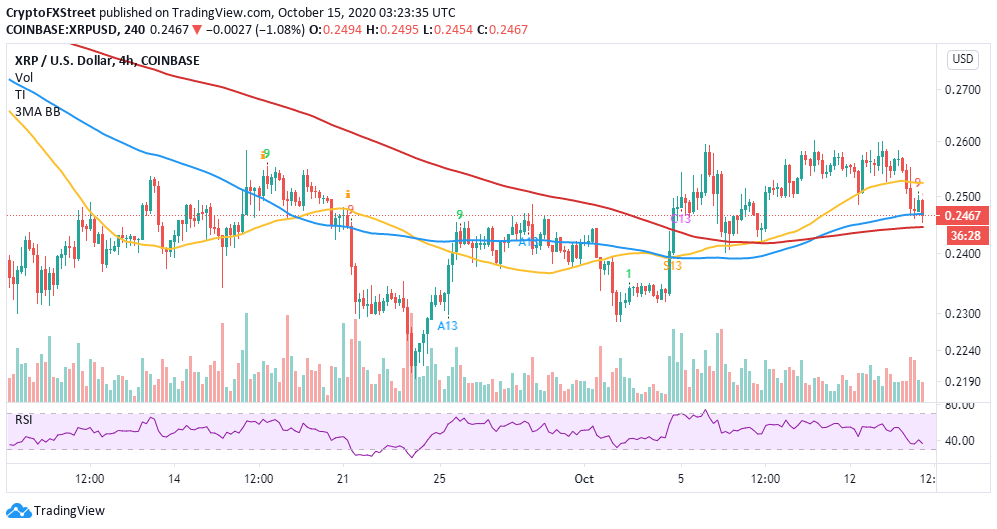
XRP is seeking support at the 100 Simple Moving Average (SMA) in the 4-hour range. Its immediate upside is capped by resistance at $0.25. Consequently, the Relative Strength Index (RSI) emphasizes the ongoing bearish momentum as it dives towards the oversold area. Another critical support is expected at the ascending trendline if the 100 SMA support caves.
Reversal from the tentative support zones must brace to face the selling pressure at the 50 SMA and in the range running from $0.255 to $0.26. The action above this zone will pave the way for gains targeting $0.3.
XRP/USD 4-hour chart
-637383307259343035.png)
The TD Sequential Indicator presents a buy signal in the form of a red nine candlestick on the 4-hour chart. If the signal materializes, XRP will resume the uptrend that has for a long time eyed $0.3. In the event the 100 SMA fails to hold the price due to the ongoing selling pressure, the 200 SMA is in line to offer the much-needed anchorage. It is essential to realize that the buy signal will be invalidated if the price slices through the 200 SMA.
XRP/USD 4-hour chart
The holder distribution metric by Santiment, a leading platform in on-chain data analysis, shows Ripple whales consistently accumulating despite the recent rejection at $0.26. Addresses containing between 100,000 and 1 million XRP increased from roughly 16,590 as recorded on September 15 to approximately 17,100 by October 14.
Similarly, over the last two days, addresses holding between 1 million and 10 million XRP increased by three, 1,329 to 1,332. In other words, this is buying pressure building up behind XRP, which might eventually culminate in the desired breakout.
Ripple holder distribution chart
 [06.34.17, 15 Oct, 2020]-637383307949089397.png)
Looking at the other side of the picture
It is worth mentioning that XRP has been rejected at $0.26 multiple times. Another rejection could come into the picture if buyers fail to gather enough strength to clear the critical hurdle. Moreover, the buy signal presented by the TD Sequential indicator could be invalidated if losses continue below the 200 SMA in the 4-hour timeframe. For now, the path of least resistance is still downwards until XRP bulls find formidable support.
Author

John Isige
FXStreet
John Isige is a seasoned cryptocurrency journalist and markets analyst committed to delivering high-quality, actionable insights tailored to traders, investors, and crypto enthusiasts. He enjoys deep dives into emerging Web3 tren


