Top 3 Price Prediction Bitcoin, Ethereum, Ripple: Crypto market gets ready for the trip to the moon
- Bitcoin's uptrend takes a hiatus at $12,500 while firmly holding the newly established support at $11,250.
- Ethereum is likely to resume the uptrend to $400; on-chain analysis shows the presence of minor hurdles.
- Ripple rejected at $0.26 as a breakdown to $0.24 looms due to the formation of an ascending triangle.

The cryptocurrency market turned a new leaf over the weekend after volatility returned. The flagship cryptocurrency broke out past $11,000 and tested resistance at $11,500. Other major assets, such as Ethereum and Ripple, also recorded impressive gains. Altcoins with smaller market capitalizations especially resumed the uptrend. Consequently, some of the most improved digital assets include Monero, up 10%, and Ren, up 21% in the last 24 hours.
Bitcoin price eyes $12,000 in the near term
The bellwether cryptocurrency completed the leg above $11,000 after a breakout from the symmetrical triangle pattern discussed last week. The rejection from $11,500 embraced support at $11,250. For now, BTC is trading between $11,250 and $11,500. The Relative Strength Index (RSI) is horizontal at 70. In other words, the sideways price action is likely to continue, but a reversal due to the oversold conditions is not yet out of the picture.
Meanwhile, a golden cross made by the 50 Simple Moving Average (SMA) crossing above the longer-term 100 SMA suggests the flagship cryptocurrency is in the bulls' hands. Action beyond $11,500 will boost the price towards $12,000.
BTC/USD 4-hour chart
 (1)-637380819305490143.png)
IntoTheBlock's IOMAP model reveals decreasing seller congestion heading to $12,000. A break above the initial resistance at $11,413 to $11,741 could boost BTC to the next target. Previously, roughly 924,000 addresses purchased almost 587,000 BTC. Action beyond this range will open the door for gains to eyeing the psychological $12,000 level.
BTC IOMAP chart
-637380819789213624.png)
On the downside, Bitcoin is accorded immense support due to the buyer congestion at lower levels. For instance, the most robust anchorage runs from $10,370 to $10,718. Here, approximately 1.7 million addresses previously bought roughly 1.1 million BTC. It is doubtful that Bitcoin will significantly reverse the current price level in the short term.
Ethereum enters another consolidation period
The smart contract giant token left several hurdles in the rearview, including $360 and $370. The second-largest crypto tested the next resistance at $380 but lost the mojo, hitting an imminent pause. At the momentum, ETH is teetering at $375 amid lock-step trading between $370 and $380. The RSI emphasizes the possibility of consolidation taking precedence in the coming sessions before a breakout occurs. On the downside, the 50 SMA's confluence and 100 SMA is in line to offer support. Other key areas likely to function as anchors include $340 and $320.
ETH/USD 4-hour chart
 (3)-637380820480887974.png)
Looking at IntoTheBlock's IOMAP model, there is no significant resistance heading to $400. Therefore, a break past $380 could see Ether make a quick run-up above $400. On the downside, considerable support has been highlighted in the range between $343 and $353. Previously, roughly 849,000 addresses bought nearly 13.2 million Ether in the area. ETH/USD is likely to bounce back up if a reversal occurs.
Ethereum IOMAP chart
-637380820855722065.png)
Simultaneously, the "Daily New Addresses" metric shows a building uptrend in the number of new addresses joining the network. New addresses soared from roughly 110,300 on October 7 to 241,000 on October 11. Ethereum's network growth shows that investors are returning ahead of the imminent launch of Ethereum 2.0. Therefore, Ether could continue with upward price action eyeing highs above $500 before 2020 ends.
Ethereum new addresses chart
-637380821969847154.png)
Ripple on the verge of a reversal
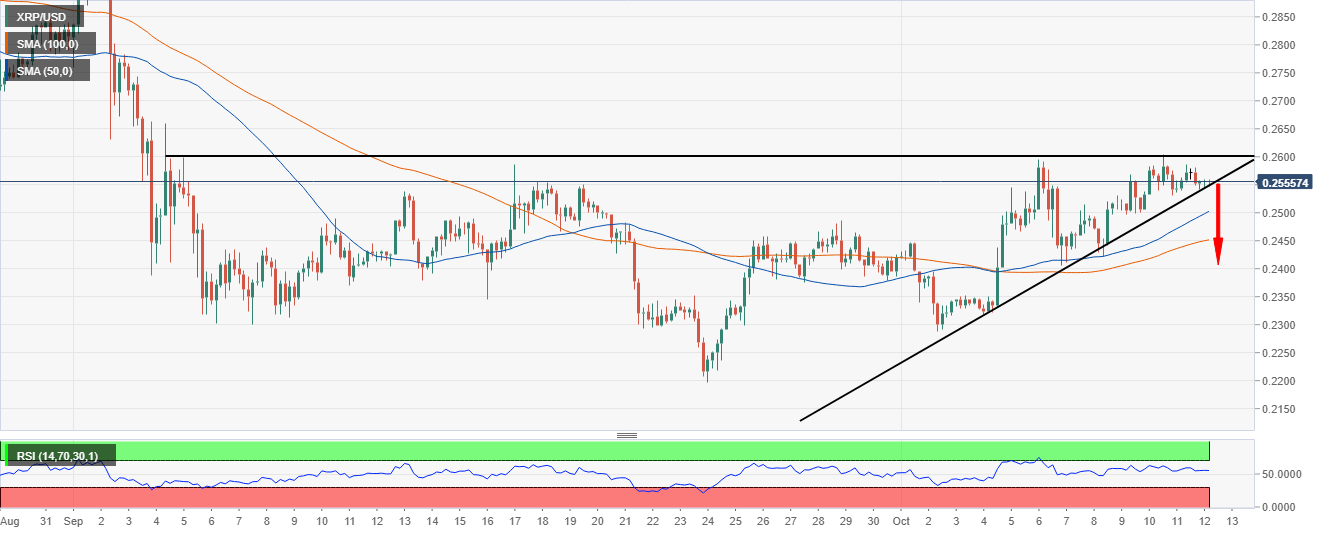
XRP resumed the uptrend after finding anchorage at $0.24 last week. Once again, bulls overcame the resistance at $0.25 but failed to clear the hurdle at $0.26. Meanwhile, the cross-border token is dancing at $0.255 while holding at the ascending triangle support. A reversal to the support at $0.24 is in the offing, mostly if the triangle support is shattered. The RSI shines a light on the impending downtrend after hitting a wall marginally above 60. The 50 SMA and 100 SMA will absorb some of the selling pressure in case of a reversal. Other key support areas include $0.23 and $0.22.
XRP/USD 4-hour chart
The number of whales holding between 100,000 and 1 million XRP continues to grow according to Santiment, a leading provider of on-chain analytics in the industry. For instance, over the last 30 days, addresses in this range have increased by roughly 650. The growth represents the growing buying pressure behind XRP. Simultaneously, it shows that whales are accumulating in anticipation of the price breaking out in the near term.
Ripple holder distribution chart
 [09.59.05, 12 Oct, 2020]-637380827580529141.png)
Daily takeaway
Bitcoin price action above $11,000 stirs bullish movements across the cryptocurrency market. However, bulls are taking a hiatus under $11,500 while holding above $11,250 for support. Gains to $12,000 are expected to resume in the coming sessions.
Ethereum hit pause at $380, after an impressive rally from $350. Sideways price action is taking place between $375 (initial support) and $380. The on-chain analysis shows the lack of significant resistance towards $400, hence another breakout.
Ripple tested the resistance at $0.26 but failed to sail through. The formation of an ascending triangle pattern means that a breakdown is in the offing. In other words, XRP could dive and retest support at $0.24 before resuming the uptrend.
Author

John Isige
FXStreet
John Isige is a seasoned cryptocurrency journalist and markets analyst committed to delivering high-quality, actionable insights tailored to traders, investors, and crypto enthusiasts. He enjoys deep dives into emerging Web3 tren


