|

Ripple Price Prediction: XRP is on the cusp of a massive price movement

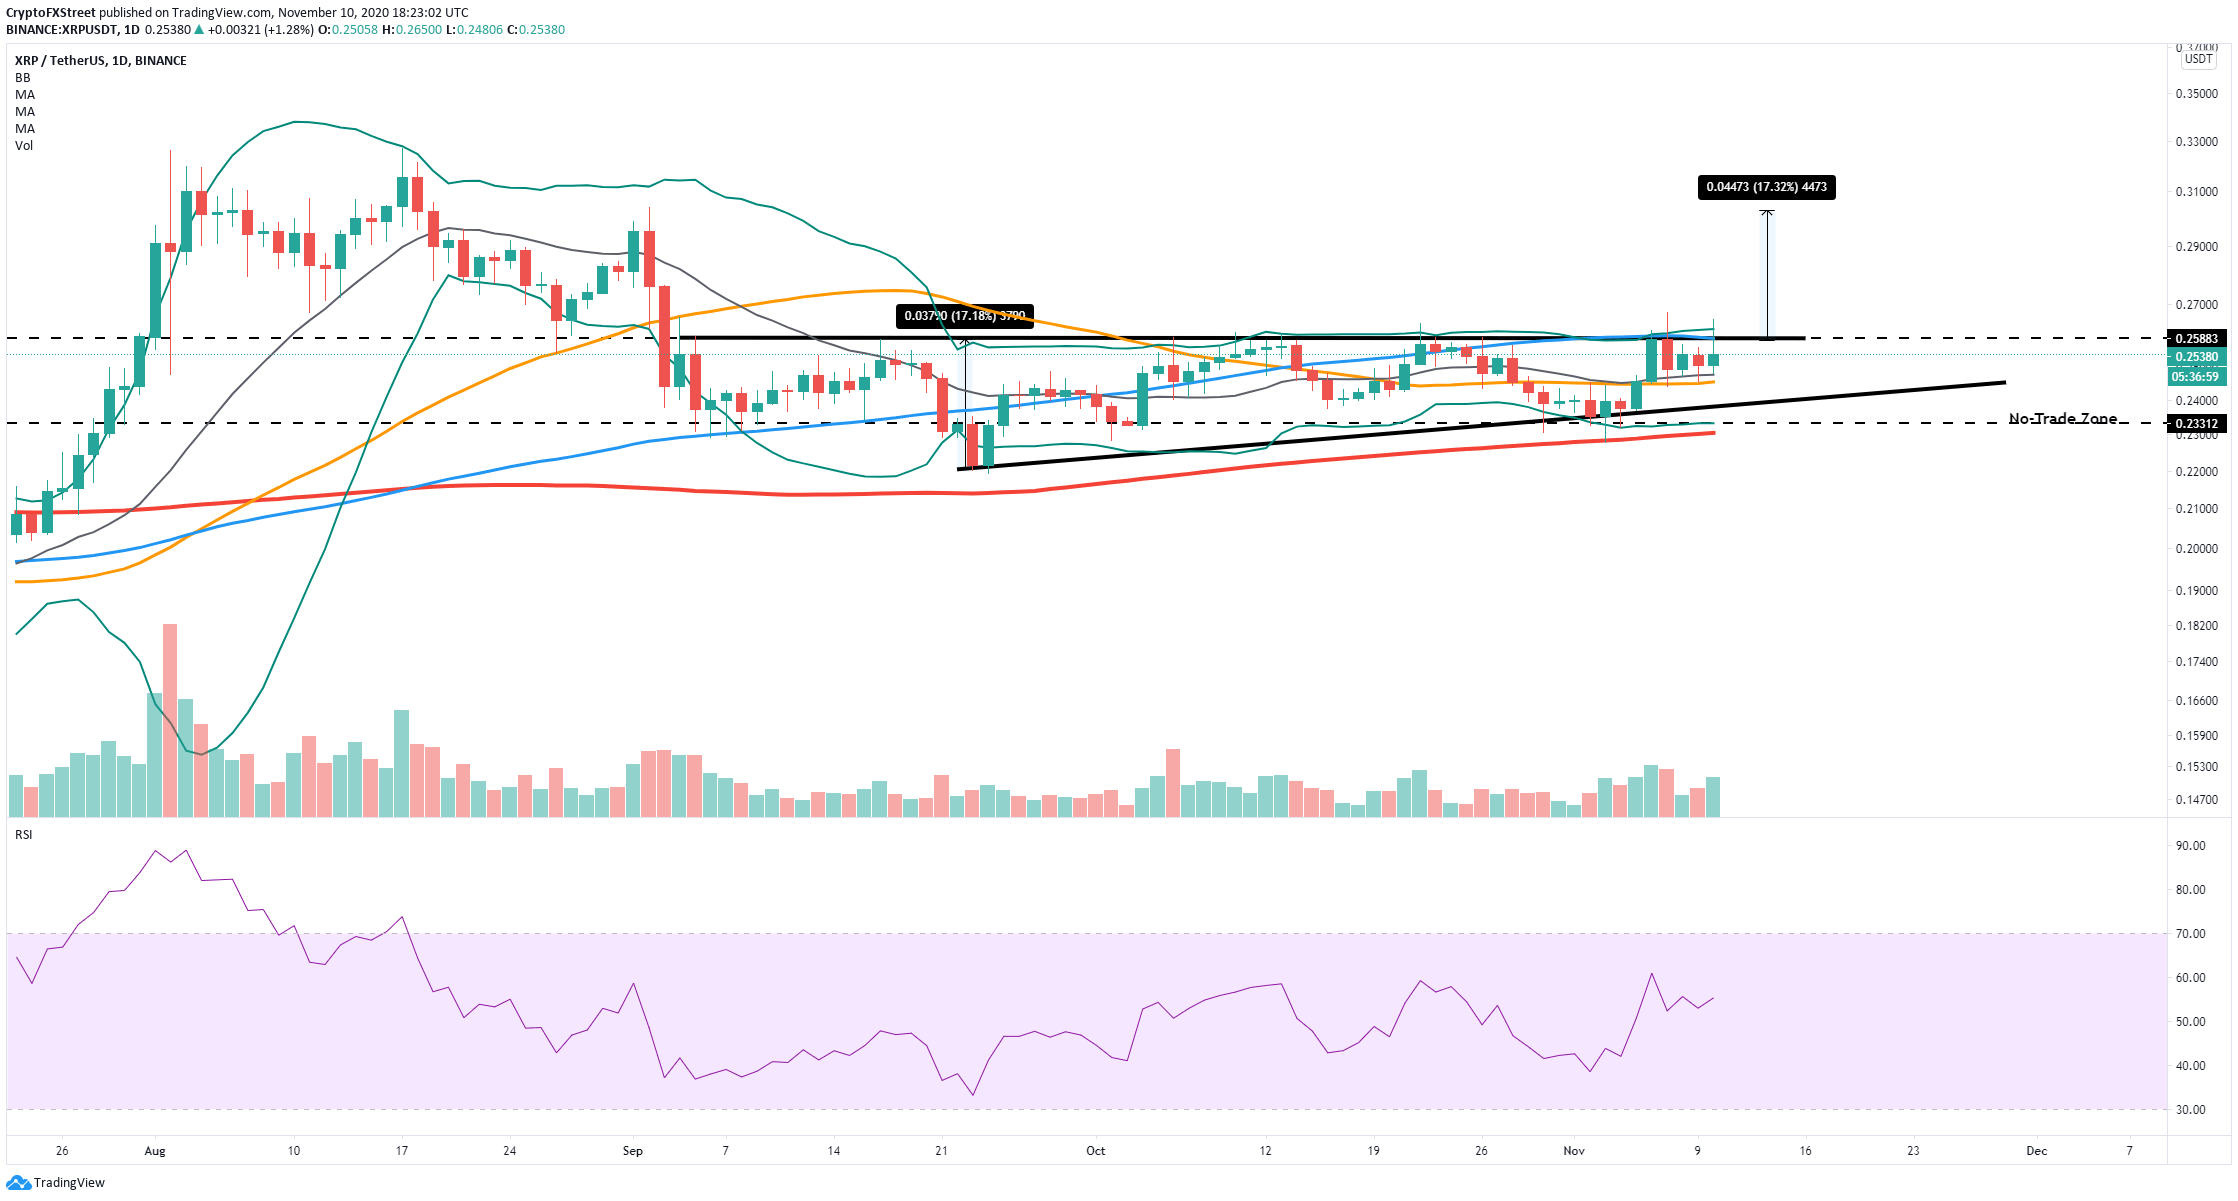
  • Ripple price is bounded inside an ascending triangle pattern formed on the daily chart.
  • Several indicators show the price is ready for a breakout in the short-term.

XRP price is currently at $0.253, right below a critical barrier at $0.26, which has been tested several times throughout the past two months. A breakout above this point can easily drive XRP price towards $0.30. 

XRP bulls need to crack $0.26 for good

XRP price has pierced through the critical resistance level at $0.26 several times in the past but never managed to close above it. The 100-SMA on the daily chart is also established at $0.26, adding even more strength to the level.
xrp price

XRP/USD daily chart

Additionally, the Bollinger Bands are squeezing significantly after a period of stagnation. The upper Band coincides with the 100-SMA and the upper boundary of the ascending triangle pattern on the daily chart. A breakout above this critical point can quickly drive XRP price towards $0.30.

xrp price

XRP Holders Distribution chart

The Holders Distribution chart shows a notable increase in the number of holders with at least 10,000,000 XRP coins from a low of 304 on November 2 to 310 currently. This growth of whales signifies a developing interest in the digital asset despite the current flat price action. 
xrp price

XRP/USD 12-hour chart

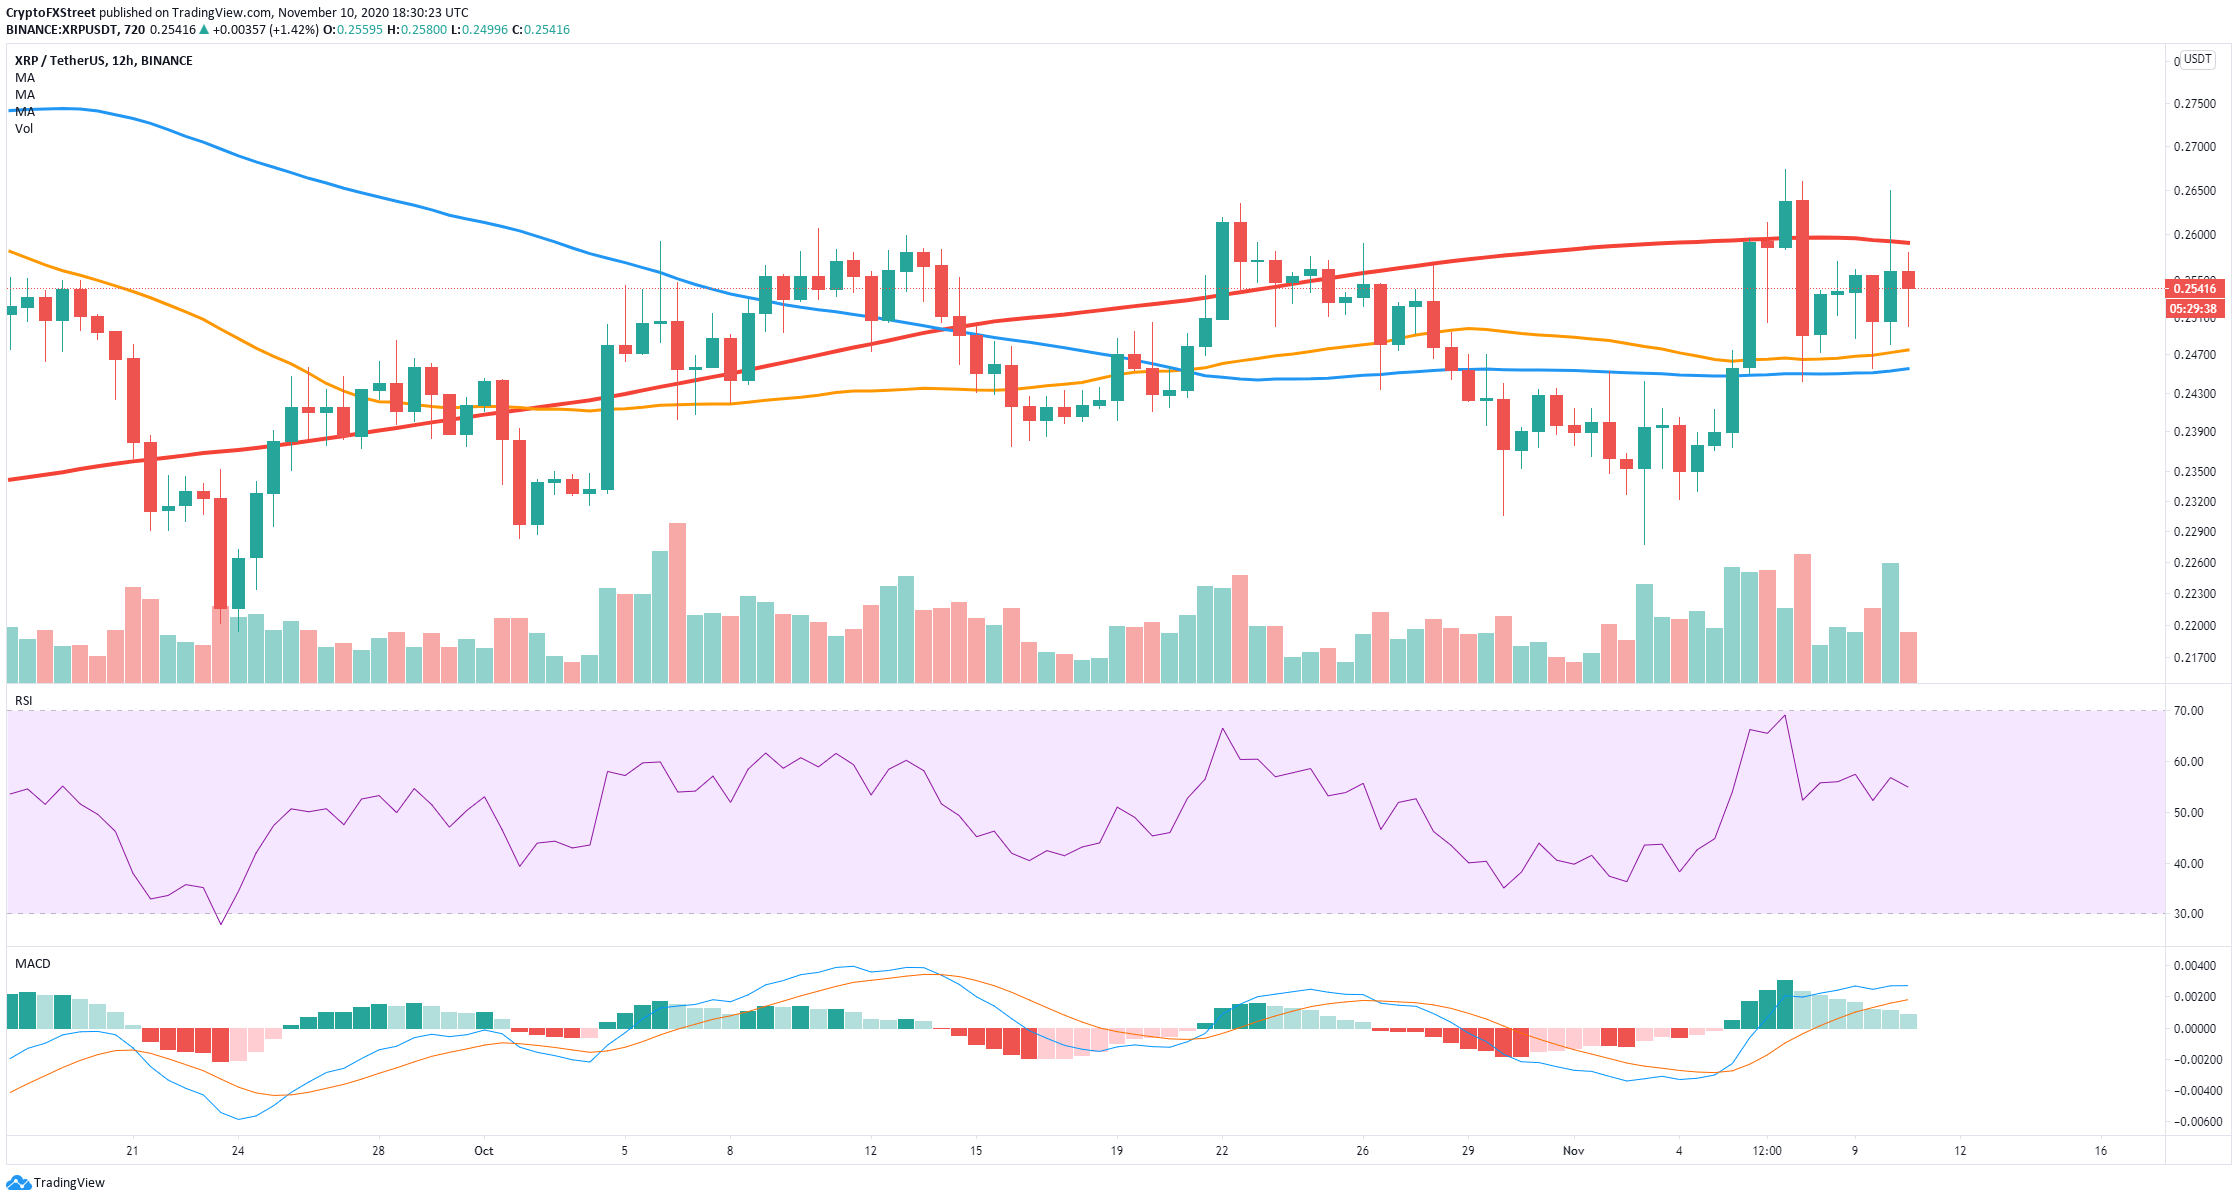
Despite the bullish metrics, XRP price got rejected from $0.26 again. On the 12-hour chart, the 200-SMA also coincides with the same level adding even more strength to it. The closest bearish price target following this rejection is $0.247, which is the 50-SMA on the 12-hour chart and also on the daily chart

Author

Lorenzo Stroe

Lorenzo Stroe

Independent Analyst

Lorenzo is an experienced Technical Analyst and Content Writer who has been working in the cryptocurrency industry since 2012. He also has a passion for trading.


More from Lorenzo Stroe
Share:

Editor's Picks

Bitcoin Weekly Forecast: BTC retreats as macro headwinds grow
Bitcoin (BTC) remains under pressure, down over 4% this week and trading around $76,900 at the time of writing on Friday. Institutional demand shows signs of weakness as spot BTC Exchange Traded Funds (ETFs) are on track to end their three-week inflow streak, recording nearly $500 million in net outflows through Thursday.
XRP falls toward key support as macro uncertainty, weak momentum cap recovery
Ripple (XRP) falls below $1.33 on Friday, marking the third consecutive day of declines. The token continues to track the broader cryptocurrency market downturn, with investors closely monitoring heightened macroeconomic uncertainty ahead of the United States (US) Consumer Price Index (CPI) release and next week’s Federal Reserve (Fed) monetary policy decision.
Crypto Today: Bitcoin, Ethereum, XRP stabilize at lower levels amid ETF outflows and macroeconomic risks
The broader cryptocurrency market is rising on Friday, with Bitcoin (BTC) trading above $77,000 after testing lower support near $76,500. Ethereum (ETH) shows signs of stability, hovering above the support provided at $2,400 despite capped upside at $2,500. Meanwhile, Ripple (XRP) holds above $1.33 after three straight days of declines, reflecting growing headwinds due to macroeconomic uncertainty.
Bitcoin pulls back as another golden cross fails to deliver
Earlier this week, Bitcoin formed a golden cross, a technical signal that occurs when the price’s 50-day moving average rises above the 200-day moving average and is conventionally viewed as a precursor to a bullish rally. Historically, however, that’s often not been the case.
Bitcoin: BTC retreats as macro headwinds grow
Bitcoin (BTC) remains under pressure, down over 4% this week and trading around $76,900 at the time of writing on Friday. Institutional demand shows signs of weakness as spot BTC Exchange Traded Funds (ETFs) are on track to end their three-week inflow streak, recording nearly $500 million in net outflows through Thursday.

