Renowned technical analyst affirms Bitcoin price is about to rally
- Benjamin Cowen has predicted a Bitcoin price rally, the analyst argues that the asset could rebound to the $40,000 level.
- Cowen believes the 200-day simple moving average is an effective indicator for predicting a Bitcoin price rally.
- Analysts evaluated the possibility of Bitcoin price rebounding from the 200-day moving average.

Bitcoin price could rebound from its recent slump and make a comeback assuming it does not get rejected at a key level, Benjamin Cowen, a leading analyst with a bullish outlook on Bitcoin price, has said.
Bitcoin price could climb to 200-day moving average level
Benjamin Cowen, CEO of Into The Cryptoverse and a leading cryptocurrency analyst recently told his 748,000 YouTube subscribers that Bitcoin price could recover from its recent drop. The analyst has identified the 200-day simple moving average (SMA) as an effective indicator of Bitcoin’s price trend.
Cowen argues that when Bitcoin price breaks below its 200-day moving average it doesn’t necessarily mean it will enter a protracted bear trend. Normally there is a relief rally back up to the 200 SMA which it then breaks above and carries on climbing. It is only on those occasions when it retests the SMA and gets rejected that it continues falling.
Bitcoin price continues to hold bullish potential, therefore, according to Cowen who expects Bitcoin’s price to return to the level of the SMA at $41,700. He also sees $40,000 as a significant level and critical milestone for Bitcoin.
By mid-June 2022, the analyst expects Bitcoin price to make a comeback to the $40,000 level. Soon after it should reach the 200-day moving average which is at about $41,700, but it is falling swiftly.
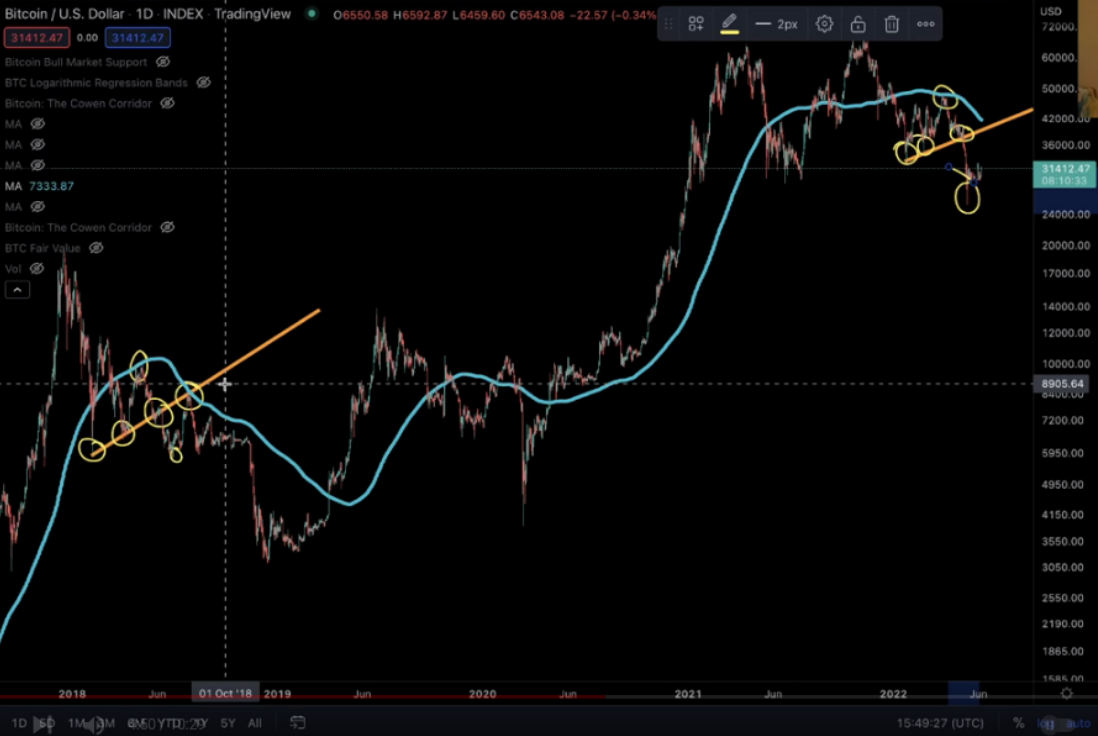
BTC-USD price chart
Two key Bitcoin price levels, 50-week and 200-week moving averages
Rekt Capital, a pseudonymous cryptocurrency analyst has identified two key levels for Bitcoin price. The analyst has identified a curious relationship between the 50-week EMA (blue) and 200-week MA (orange).
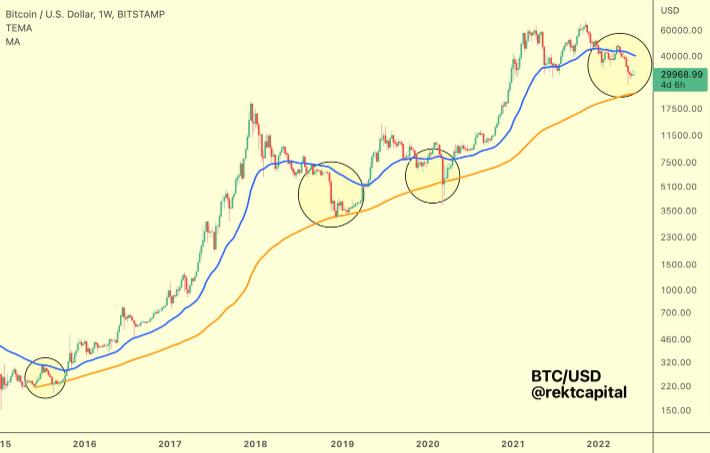
BTC-USD price chart
Rekt argues that after the BTC price has broken below its 50 WEMA and then retested the EMA but failed to break above it again, it usually marks the beginning of a sell-off down to the 200 WEMA. At that level, however, it eventually finds a floor and begins a new bull run.
Historically, this has happened on three previous occasions and this year could be the fourth instance of that phenomenon. In 2015, Bitcoin price was rejected from the 50-week EMA and rebounded from the 200-week moving average. The first attempt to rebound was a solid one, however a macro price reversal followed.
The second instance was in 2018-19 when Bitcoin price witnessed a lengthy consolidation period after getting rejected from the 50-week EMA. Bitcoin rebounded and retested the 200-week moving average before starting a new bull run.
Similar to previous years, in 2020 Bitcoin price tested the 50-week exponential moving average before lifting off into a bull run.
Much like previous years, in 2022 Bitcoin price consolidated below the 50 WEMA and then crashed towards the 200-week moving average. Based on the repetitive or cyclical nature of the Bitcoin price trend, the same pattern could repeat itself and the analyst argues the asset could begin a bull run soon.
FXStreet analysts have identified an upcoming price rally in Tron and predicted an explosive breakout in the altcoin.
Author

Ekta Mourya
FXStreet
Ekta Mourya has extensive experience in fundamental and on-chain analysis, particularly focused on impact of macroeconomics and central bank policies on cryptocurrencies.


