Investors buy the dip as sovereign countries turn to Bitcoin to shelter from inflation
- Argentina has become an increasingly Bitcoin-friendly country, turns to BTC to hedge against inflation.
- Bitcoin holders doubled down on their BTC holdings when the asset nosedived below $30,000, indicating heavy accumulation.
- Analysts identified bullish signals on the daily Bitcoin price chart, believing the current bullish trend is strong.

On-chain data, technical analysis hints and macroeconomic developments are turning in favor of Bitcoin price bulls. Argentina relies heavily on Bitcoin to fight inflation and the depreciation of the Argentinean peso. Bitcoin long-term holders continued accumulating the asset through the recent dip below $30,000. On-chain data predicts Bitcoin accumulation and a bullish outlook of investors on BTC.
Also Read: JPMorgan says Bitcoin fair value is $38,000, under one condition
Argentina's crypto penetration doubles, country relies on Bitcoin
Argentina has been engaged in a constant war against inflation in its country. The Argentinean peso has declined, negatively influencing the purchasing power of citizens. The peso's decline is triggered by a lack of trust in the central bank and government overspending.
With 37.3% of the South American nation's population under the poverty line, citizens turn to Bitcoin as a hedge against inflation. Americas Market Intelligence report on "The Cryptocurrency Revolution in Latin American Payments" revealed that crypto penetration in Argentina had reached 12%, double that of Peru, Mexico and other countries in the region. The report shared insights on the rate of cryptocurrency uptake by Latin Americans has reached nearly half of credit card ownership in some markets, indicating an impressive foothold of Bitcoin in these countries.
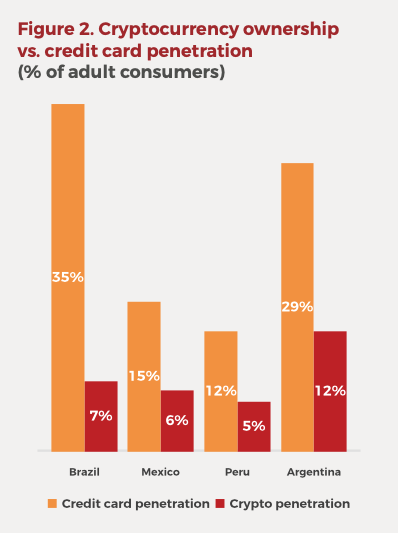
Cryptocurrency ownership vs. credit card penetration
The report predicts that Bitcoin investments will remain synonymous with volatility and continue enticing investors in Argentina and Latin American countries, as BTC remains a hedge against inflation.
Bitcoin price rally fueled by heavy BTC accumulation
Bitcoin price recovered from its drop below $30,000, and investors identified this as an opportunity to accumulate the asset.
Bitcoin accumulation trend score is an indicator that reflects the relative size of entities accumulating BTC in terms of their holdings. It factors in the entity's Bitcoin balance (participation score) and the amount of coins they have accumulated (balance change score). The metric has returned to a near-perfect score above 0.9, based on data from the crypto intelligence platform, Glassnode. According to them, a high Bitcoin accumulation trend score after a significant asset price correction represents a shift in investor sentiment from uncertainty to value accumulation.
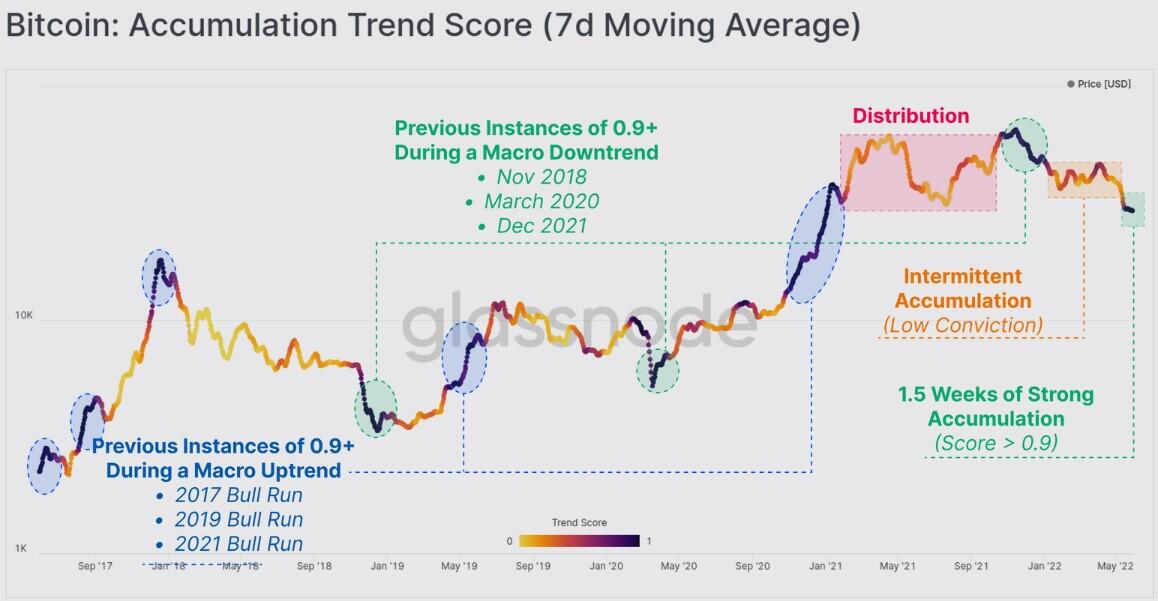
Bitcoin Accumulation Trend Score (7-day moving average)
Ki Young Ju, the CEO of CryptoQuant.com, believes it is obvious that Bitcoin is in the accumulation phase. In the recent dip, the CryptoQuant CEO noted that institutional investors that drove the 2021 Bitcoin bull run had acquired BTC in the $25,000-to-$30,000 range.
The last #Bitcoin accumulation phase was in mid-2020, lasting for 6 months.
— Ki Young Ju (@ki_young_ju) May 29, 2022
As of May 2022, for me, it's pretty obvious that $BTC is in an accumulation phase. Institutions that drove the 2021 bull-run bought in this $25-30k range too.
Why not buy? Serious question. https://t.co/hvHX0bPa6b
Bitcoin dominance shoots up, hits 43.9%
Rising Bitcoin dominance is considered a key factor in the asset's rally above $31,708. Bitcoin price recovered from its drop below $30,000 with an increase in dominance, hitting a high of 46%, the highest level since October 2021. Closing the ninth weekly red candle in a row, Bitcoin dominance hit a local high before the asset climbed towards the $31,000 level.
@venturefounder, an analyst at CryptoQuant.com, argues that after twelve months of consolidation, Bitcoin dominance finally broke out. While altcoins struggle to recover, Bitcoin dominance is likely to top out before 70% in the current cycle. @venturefounder believes that the highest probability range is between 50-63%.
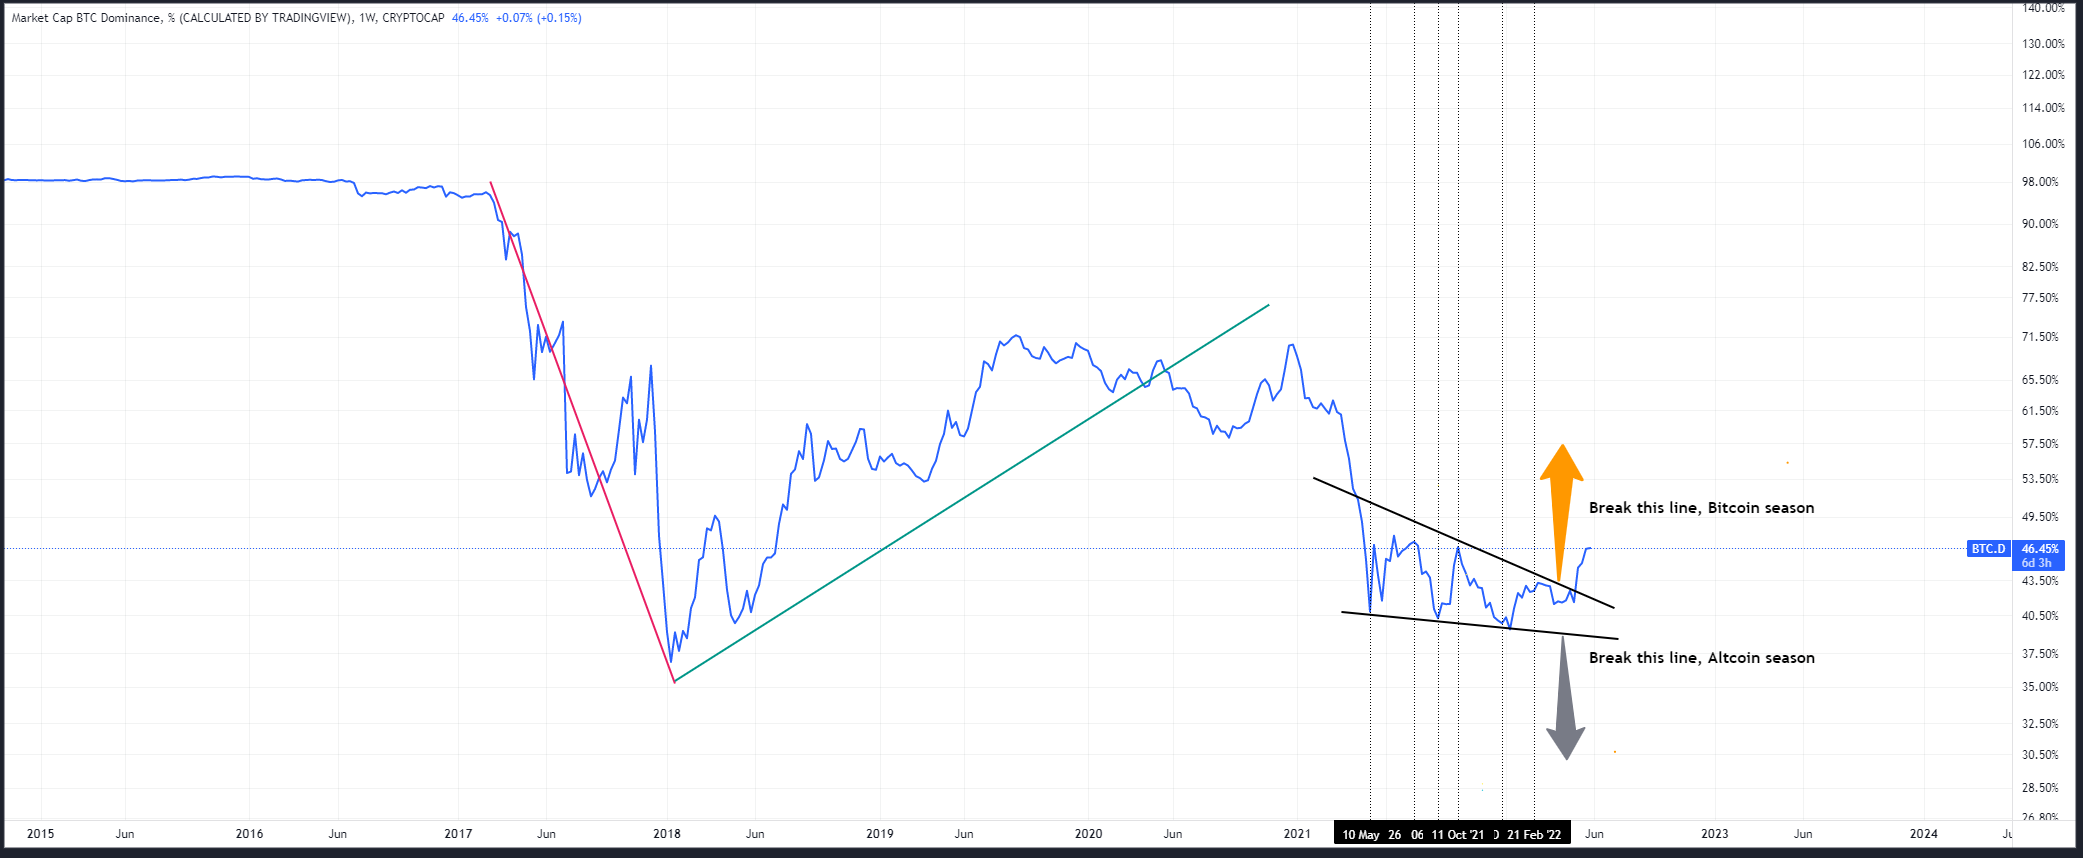
Bitcoin dominance chart
Bitcoin price chart flashes bullish signals
Bitcoin price has flashed bullish signals on the one-day price chart. The Relative Strength Index, developed by J.Welles Wilder, is a momentum oscillator that measures the speed and change of price movements. The RSI oscillates between 0 and 100, and it has currently moved north, near the 50 line. Traditionally when the RSI is close to 50, it signifies increased demand among market participants and a rise in bullish pressure on Bitcoin.
The Average Directional Index (ADX) is a technical analysis indicator used to determine the strength of a trend. It has hit the 40-mark, indicating the bullish trend is strong.
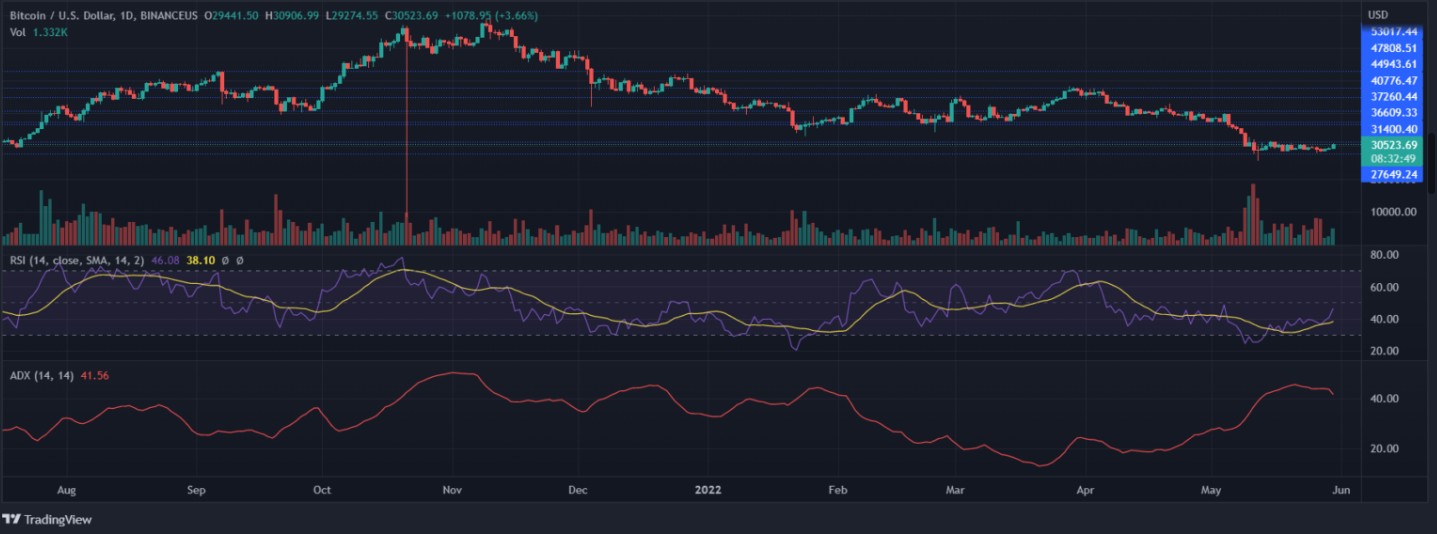
BTCUSD price chart
Watch the following video to see where FXStreet analysts foresee Bitcoin price going next:
Author

Ekta Mourya
FXStreet
Ekta Mourya has extensive experience in fundamental and on-chain analysis, particularly focused on impact of macroeconomics and central bank policies on cryptocurrencies.


