• Polygon price formed a bullish divergence on a momentum indicator, signaling a reversal.
  • On-chain data shows MATIC’s capitulation event occurred between June 12 and 18.
  • Supply Distribution reveals that two cohorts of whales bought as MATIC dips.
  • A daily candlestick close below $0.509 would invalidate the bullish thesis.


Polygon (MATIC) price displays a bullish divergence on a momentum indicator, indicating a bullish move. Recent on-chain data reveals a capitulation event occurred from June 12 to 18, prompting a group of whales to accumulate MATIC tokens, further bolstering bullish sentiment for an upward trajectory.

MATIC sets up for a 10% rally

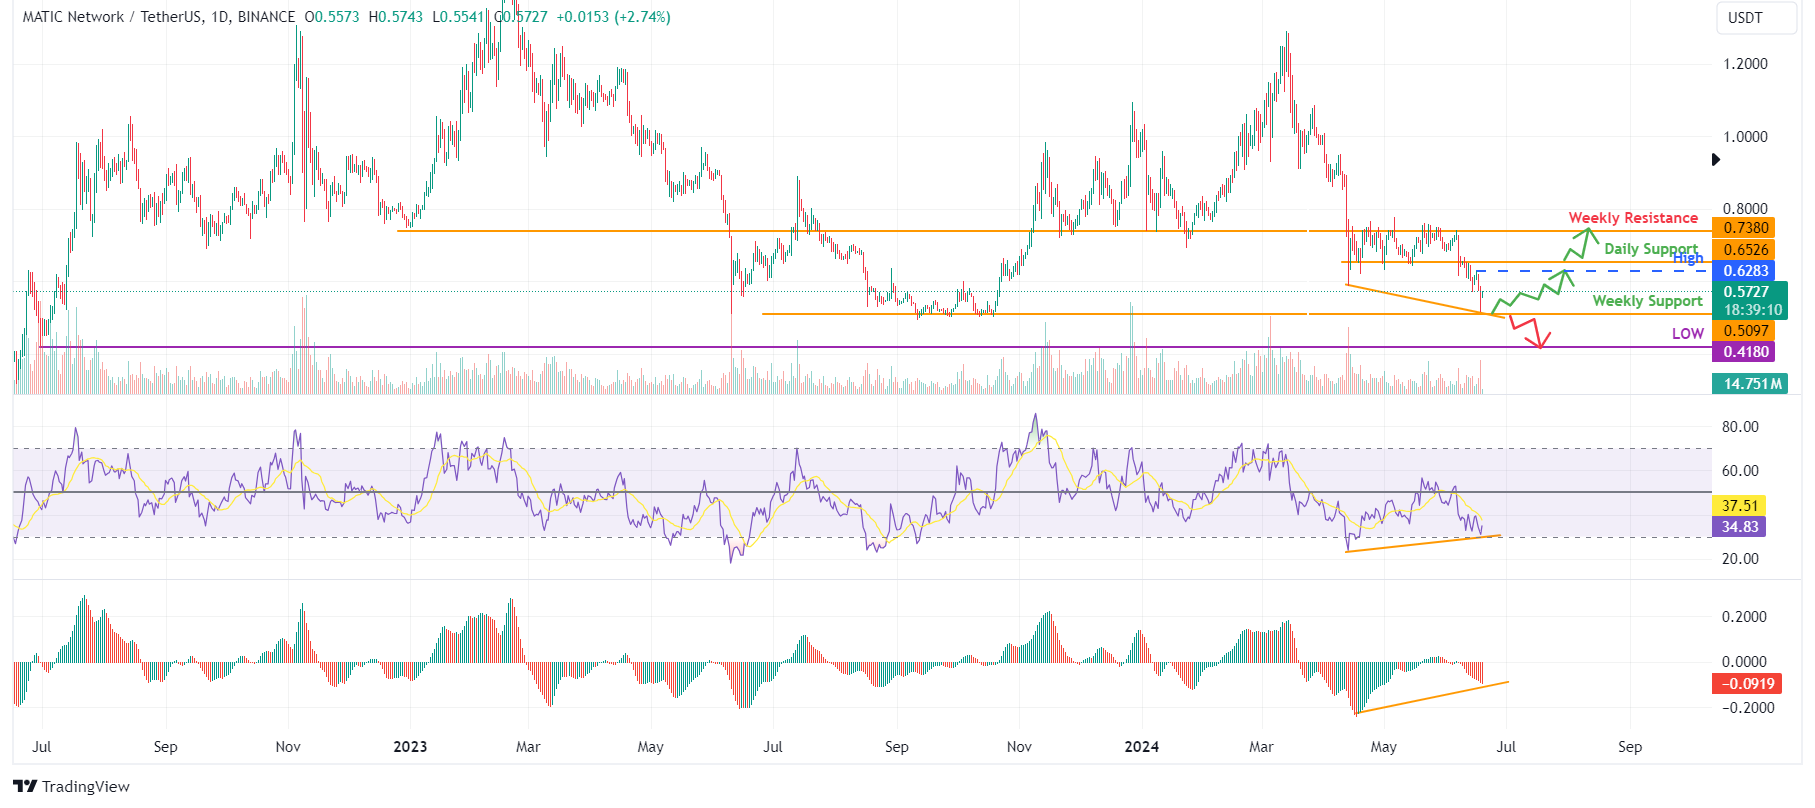
Polygon price retested its weekly support level of $0.509 on Tuesday and bounced 8% to $0.572, where it is currently trading.

Additionally, the lower low formed on June 18 does not reflect the Relative Strength Index’s (RSI) higher highs for the same period. This development is termed a bullish divergence and often leads to the reversal of the trend or a short-term rally.

If the $0.509 level holds, Matic could rally 10% from its current trading price of $0.572 to tag its daily high of $0.628 on June 16.

Moreover, if MATIC closes above the $0.652 daily resistance level, it could extend an additional 17% rally to retest its weekly resistance level of $0.738.

MATIC 1-day chart

MATIC 1-day chart

On-chain data provider Santiment’s Network Realized Profit/Loss (NPL) indicator computes a daily network-level Return On Investment (ROI) based on the coin’s on-chain transaction volume. Simply put, it is used to measure market pain. Strong spikes in a coin’s NPL indicate that its holders are on average, selling their bags at a significant profit. On the other hand, strong dips imply that the coin’s holders are on average realizing losses, suggesting panic sell-offs and investor capitulation. 

In MATIC’s case, the NPL indicator had spiked twice, -5.3 million and -3.15 million, between June 12 and 18, coinciding with a 14% price crash. This negative downtick indicates that the holders are, on average, realizing losses, suggesting panic sell-offs and investor capitulation.

MATIC Network Realized Profit/Loss chart

MATIC Network Realized Profit/Loss chart

Santiment’s Supply Distribution metric shows that whales with 1 million to 10 million (Yellow line) MATIC  tokens dropped from 218.82 million to 251.70 million between June 12 and 18. Meanwhile, wallet holdings of 10 million to 100 million (Blue line) and 100,000 to 1 million (Red line) MATIC tokens surged from 218.82 million to 243.09 million and 201.01 million to 206.42 million, respectively, in the same period.

This interesting development shows that the first cohort of whales could have fallen prey to the capitulation event. In contrast, the second and third sets of wallets seized the opportunity and accumulated MATIC at a discount.

MATIC Supply Distribution chart

MATIC Supply Distribution chart

Even though on-chain metrics and technical analysis point to a bullish outlook, if Polygon's price produces a daily candlestick close below $0.509, the weekly support, the move would invalidate the bullish thesis by making a lower low on the daily time frame. This development could see MATIC's price crash by 18% to retest its daily low of $0.418 from June 30, 2022.


Information on these pages contains forward-looking statements that involve risks and uncertainties. Markets and instruments profiled on this page are for informational purposes only and should not in any way come across as a recommendation to buy or sell in these assets. You should do your own thorough research before making any investment decisions. FXStreet does not in any way guarantee that this information is free from mistakes, errors, or material misstatements. It also does not guarantee that this information is of a timely nature. Investing in Open Markets involves a great deal of risk, including the loss of all or a portion of your investment, as well as emotional distress. All risks, losses and costs associated with investing, including total loss of principal, are your responsibility. The views and opinions expressed in this article are those of the authors and do not necessarily reflect the official policy or position of FXStreet nor its advertisers. The author will not be held responsible for information that is found at the end of links posted on this page.

If not otherwise explicitly mentioned in the body of the article, at the time of writing, the author has no position in any stock mentioned in this article and no business relationship with any company mentioned. The author has not received compensation for writing this article, other than from FXStreet.

FXStreet and the author do not provide personalized recommendations. The author makes no representations as to the accuracy, completeness, or suitability of this information. FXStreet and the author will not be liable for any errors, omissions or any losses, injuries or damages arising from this information and its display or use. Errors and omissions excepted.

The author and FXStreet are not registered investment advisors and nothing in this article is intended to be investment advice.

Recommended content


Recommended Content

Editors’ Picks

Bitcoin volatility hits multi-month lows, raising concerns of liquidation cascades

Bitcoin volatility hits multi-month lows, raising concerns of liquidation cascades

Bitcoin price has been consolidating between $94,000 and $100,000 for two weeks. Defund exchange FTX repayments on Tuesday dipped Bitcoin towards its lower boundary of the consolidating range.

More Bitcoin News
Litecoin bulls target $170 mark as open interest reaches four-year high of $887 million

Litecoin bulls target $170 mark as open interest reaches four-year high of $887 million

Litecoin price extends its gains and recovers above the $135.00 level on Wednesday, rallying over 7% so far this week. LTC’s open interest hints at a continuation of the rally as it reaches the highest level since May 12, 2021, of $887 million. 

More Litecoin News
Maker Price Forecast: MKR generates highest daily revenue of $10 million

Maker Price Forecast: MKR generates highest daily revenue of $10 million

Maker price extends its gains by 6%, trading around $1,189 on Wednesday after rallying more than 20% so far this week. On-chain data support a bullish move ahead as MKR generated a new yearly high in daily revenue, and funding rate data is positive.

More Maker News
Ripple's XRP holds symmetrical triangle support as SEC acknowledges Bitwise XRP ETF filings

Ripple's XRP holds symmetrical triangle support as SEC acknowledges Bitwise XRP ETF filings

Ripple's XRP is down 3% on Tuesday despite the Securities and Exchange Commission (SEC) acknowledgment of Bitwise XRP ETF. Unchained Crypto noted that XRP ETF could underperform due to key fundamental issues.

More Ripple News
Bitcoin: BTC consolidates before a big move

Bitcoin: BTC consolidates before a big move

Bitcoin price has been consolidating between $94,000 and $100,000 for the last ten days. US Bitcoin spot ETF data recorded a total net outflow of $650.80 million until Thursday.

Read full analysis
The Best brokers to trade EUR/USD

The Best brokers to trade EUR/USD

SPONSORED Discover the top brokers for trading EUR/USD in 2025. Our list features brokers with competitive spreads, fast execution, and powerful platforms. Whether you're a beginner or an expert, find the right partner to navigate the dynamic Forex market.

Read More

BTC

ETH

XRP