Polkadot proposal to increase validator count fails as DOT price prepares for 30% upswing
- Polkadot price is currently hovering above the $23.66 support level after an 18% retracement.
- Referendum 29, which proposes to increase validators to 399, is failing with a 0.38% turnout.
- A breakdown of the $19.71 support barrier will invalidate the bullish thesis.

Polkadot price is currently experiencing a sell-off after a massive upswing. This pullback paves the way for the sidelined investors to have the opportunity to invest in DOT at a discounted price, allowing the next leg-up to have an extra oomph.
Proposal to increase validator count fails
Referendum 29, among other things, is a proposal to increase the validator count from 300 to 399. While controversial, the 0.38% turnout shows that this change will not occur.
Roughly 36 hours remain until the voting period expires. At the time of writing, nearly 2.7 million DOT have been staked to implement this change, while 1.5 million DOT have been stacked against it.
Referring to the proposal mentioned above, the parachain's official team adds:
increasing the validator count relative to the amount of validators participating in parachains will lead to increased variance of rewards. For that reason, the parachains team recommends keeping the amount of validators low to achieve an outcome of low reward variance, an earlier launch of parachains and consensus stability.
While the number of validators remains unchanged, technicals indicate that Polkadot price is eyeing a reversal.
Polkadot price plans comeback
Polkadot price rallied 46% from August 9 to August 17 to set up a range high at $27.45, but DOT has since retraced roughly 18% as it briefly shattered the $23.64 support level. However, Polkadot price has managed to quickly recover above the demand barrier mentioned above and shows confidence that it will continue to climb.
Regardless, investors need to be open to a pullback to $21.84.
Either way, market participants can expect a resurgence of buying pressure around any of the support levels mentioned above. In such a case, the upside for the recovery rally seems to be capped at around $31.38, roughly a 32% ascent from $23.64.
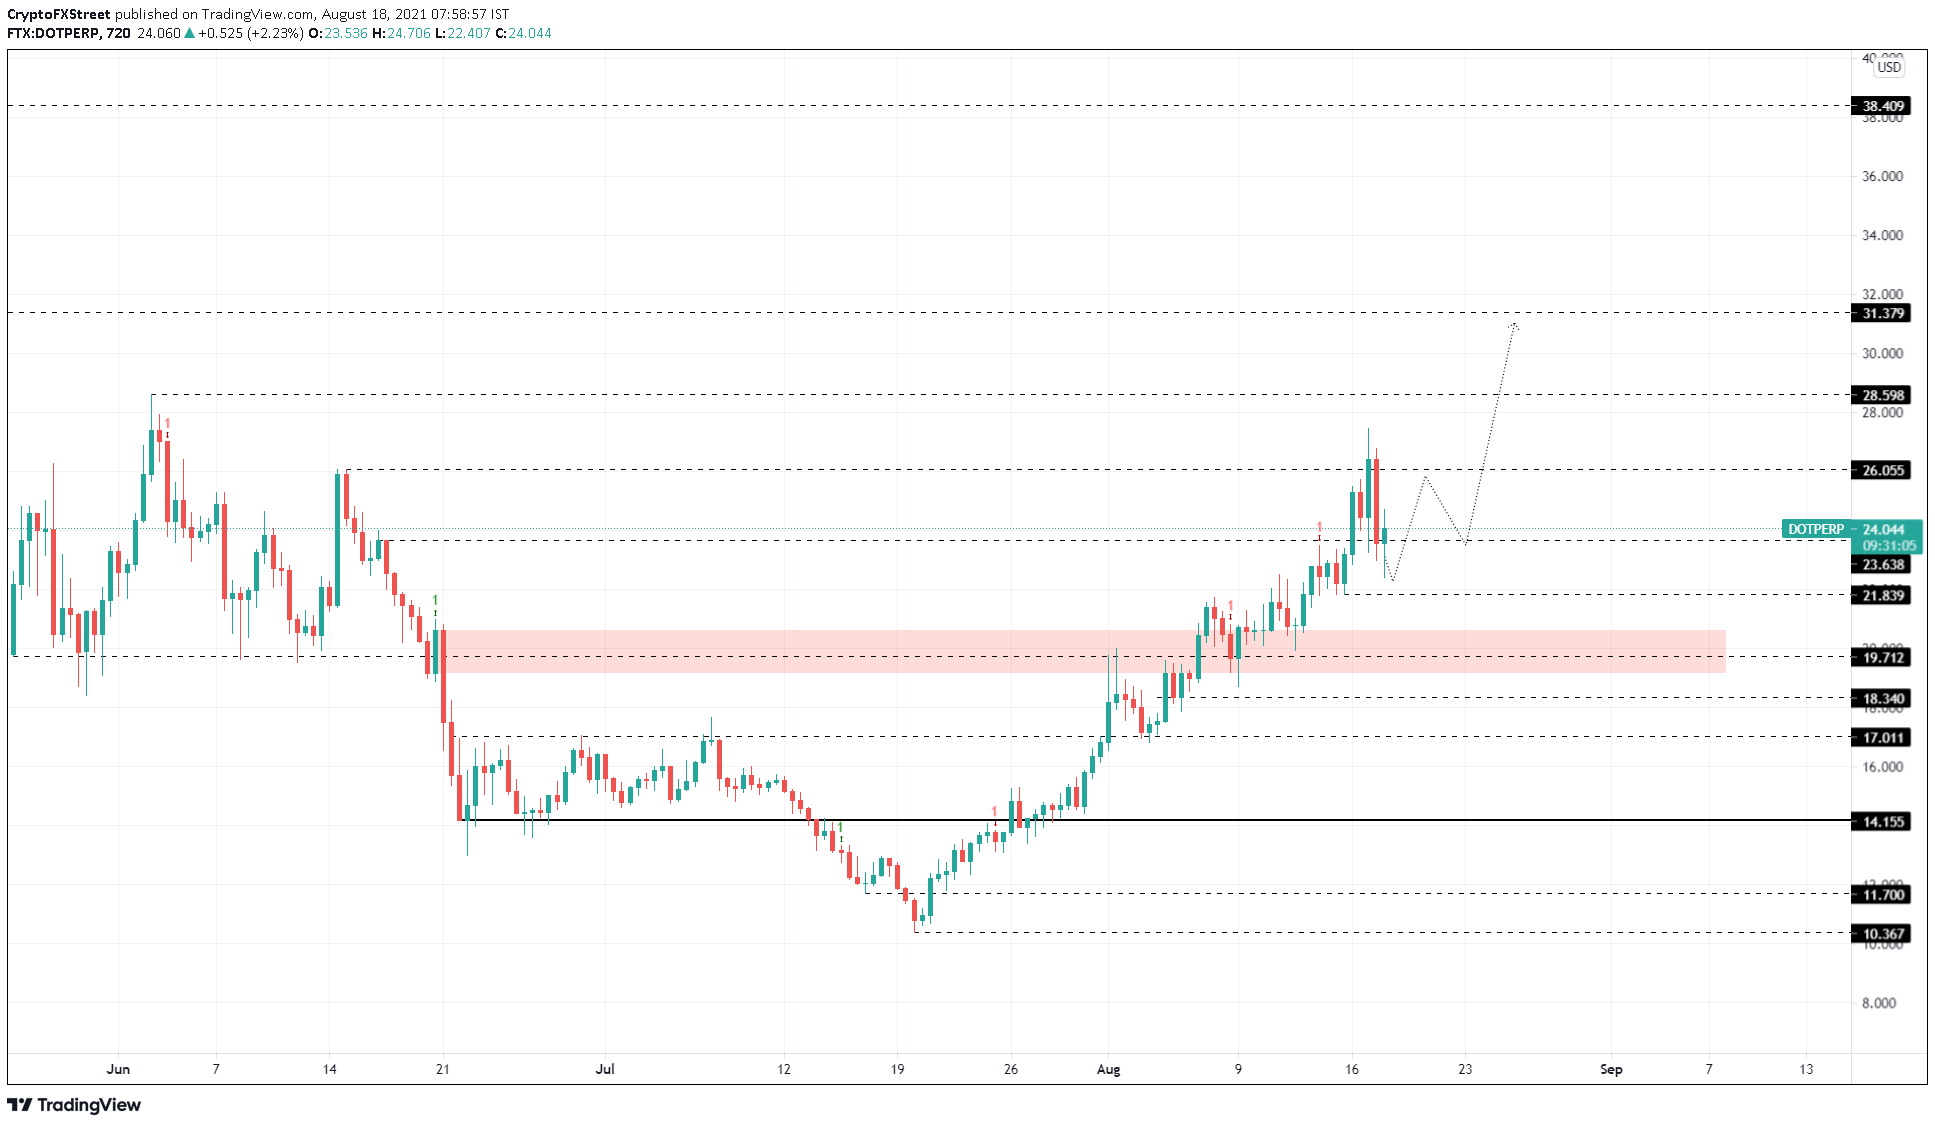
DOT/USDT 12-hour chart
On the other hand, a breakdown of the $21.84 demand barrier will indicate a weakness among buyers and open the path for further descent. This move does not invalidate the bullish thesis, but a breakdown of the $19.71 support level will.
Under these circumstances, investors can expect Polkadot price to explore a retest of the $18.34 and $17.01 footholds.
Author

Akash Girimath
FXStreet
Akash Girimath is a Mechanical Engineer interested in the chaos of the financial markets. Trying to make sense of this convoluted yet fascinating space, he switched his engineering job to become a crypto reporter and analyst.


