• Polkadot price has been setting higher highs and higher lows since the beginning of August.
  • The price trend suggests that DOT is expecting a sizeable move to the upside, should it surpass the resistances ahead.
  • Moving forward, a 40% surge is on the radar if Polkadot secures $25.10. 

Polkadot price is slowly working its way toward a 40% climb as it continues to record higher highs and higher lows. DOT has rallied by over 116% since the July 20 low, marking a high not seen since June 21, at $23.51.

Polkadot price gears up for rally

Polkadot price has formed an ascending parallel channel on the 12-hour chart, as DOT has consecutively recorded higher peaks and higher troughs. 

The governing technical pattern suggests that the altcoin is headed for a move higher, with a measured target of a 21% surge from the upper boundary of the parallel channel at $31.31, the May 20 high.

Currently, the first obstacle for Polkadot price is the 61.8% Fibonacci extension level at $23.37, then the topside trend line of the prevailing chart pattern at $25.10, coinciding with the breakout line given by the Momentum Reversal Indicator (MRI).

The last hurdle prior to reaching the bullish target is at the 78.2% Fibonacci extension level at $26.83. Investors should note that only a spike in buying pressure would confirm accelerating interest, incentivizing Polkadot price to achieve the bullish forecast.

DOTUSDT

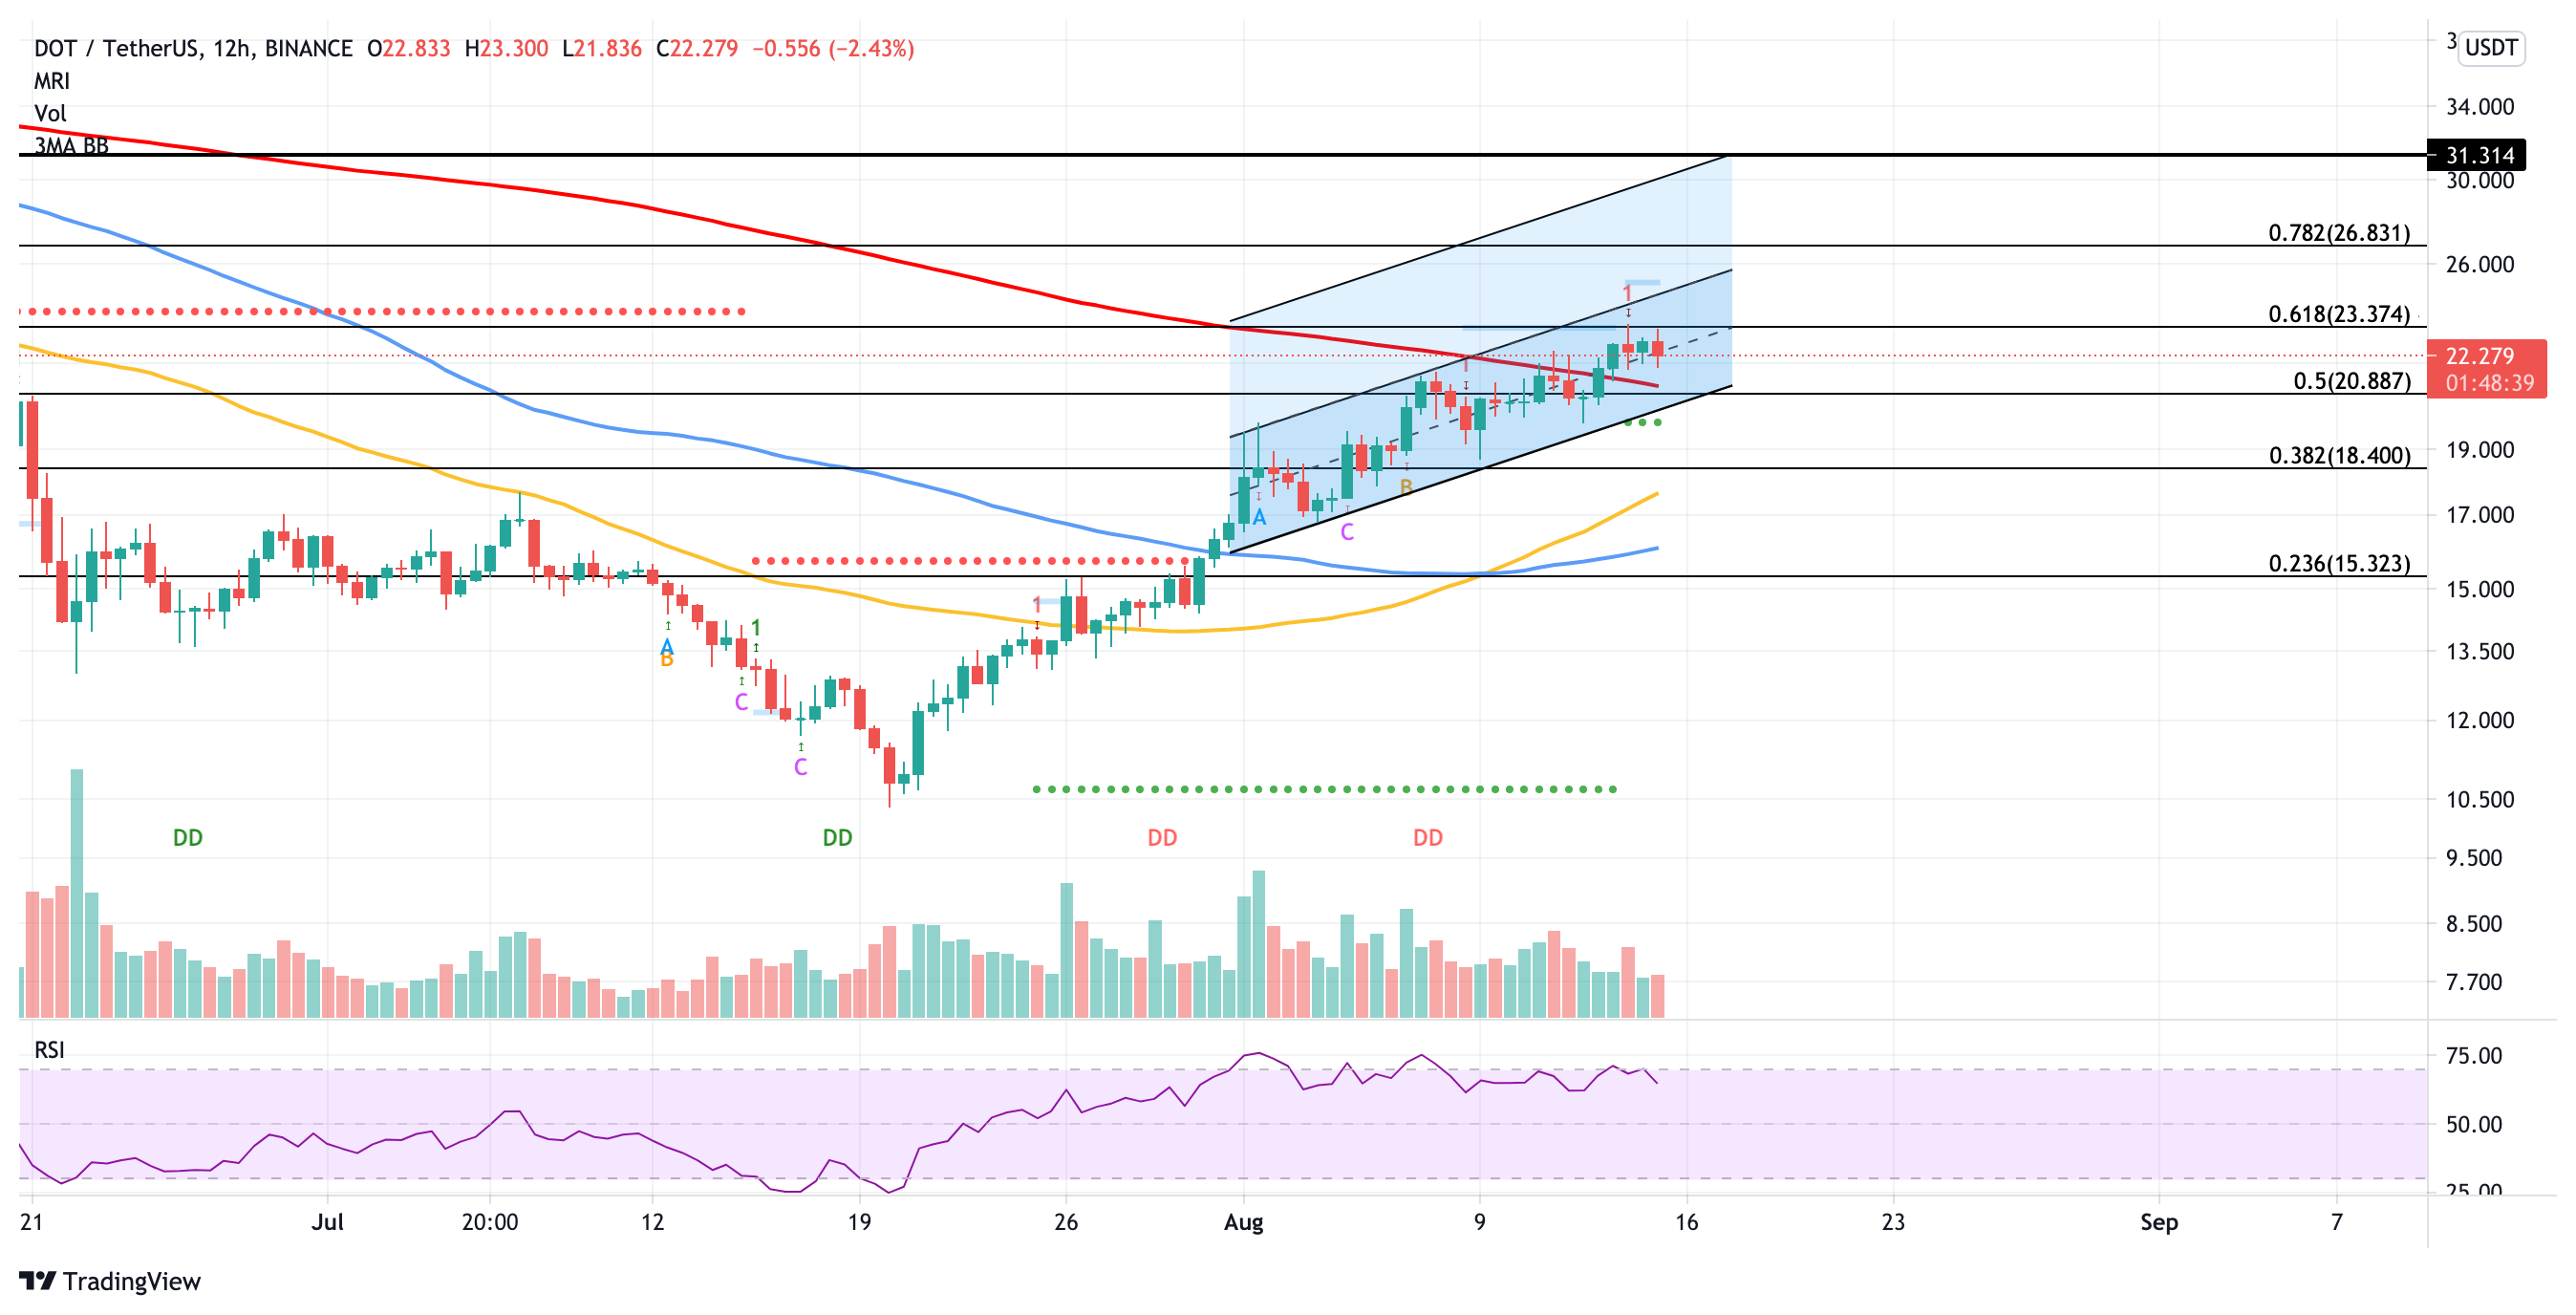
DOT/USDT 12-hour chart

Should the buyers fail to lift prices higher against the sellers, DOT may continue to move sideways within the parallel channel until either the bulls or the bears take charge. 

The first line of defense for Polkadot price is at the 200 twelve-hour Simple Moving Average (SMA) at $21.07, nearing the 50% Fibonacci extension level. Further selling pressure may see DOT fall further to retest the lower boundary of the parallel channel as support at $20.47.

In the event of Polkadot price slicing below the aforementioned level of support, DOT test the reliability of the support line given by the MRI at $19.88 before dropping further to discover support at the 38.2% Fibonacci extension level at $18.40.

A robust trend reversal may see Polkadot price collapse to reach the 50 and 100 twelve-hour SMAs. However, this reversal of fortune is not expected unless a massive spike in selling pressure materializes. 


Note: All information on this page is subject to change. The use of this website constitutes acceptance of our user agreement. Please read our privacy policy and legal disclaimer. Opinions expressed at FXstreet.com are those of the individual authors and do not necessarily represent the opinion of FXstreet.com or its management. Risk Disclosure: Trading foreign exchange on margin carries a high level of risk, and may not be suitable for all investors. The high degree of leverage can work against you as well as for you. Before deciding to invest in foreign exchange you should carefully consider your investment objectives, level of experience, and risk appetite. The possibility exists that you could sustain a loss of some or all of your initial investment and therefore you should not invest money that you cannot afford to lose. You should be aware of all the risks associated with foreign exchange trading, and seek advice from an independent financial advisor if you have any doubts.

Recommended content


Recommended Content

Editors’ Picks

Bitcoin Weekly Forecast: Fed-led rally could have legs towards $65,000

Bitcoin Weekly Forecast: Fed-led rally could have legs towards $65,000

Bitcoin has risen 7% so far this week, supported by the US Fed interest-rate cut and more than $300 million in ETFs inflows. The recent surge led BTC price to shatter several key technical resistance levels, a sign that the current two-week rally has likely some more way to go towards $65,000.

More Bitcoin News
Ethereum, BNB and POL holders on the watch as BingX faces loss of $26 million in hack

Ethereum, BNB and POL holders on the watch as BingX faces loss of $26 million in hack

Crypto exchange BingX said on Friday that it suffered a hack, an attack that led to “minimal” losses that researchers at PeckShield estimate at $26.68 million.  The attacker swapped the stolen altcoins for Ethereum, Binance Coin and Polygon tokens, according to on-chain data. 

More Cryptocurrencies News
Pepe price forecast: Eyes for 30% rally

Pepe price forecast: Eyes for 30% rally

Pepe extends the upward movement on Friday after breaking above the descending trendline and resistance barrier on Thursday. PEPE’s dormant wallets are in motion, and the long-to-short ratio is above one, further supporting this bullish move and hinting at a rally on the horizon.

More PEPE News
Shiba Inu is poised for a rally as price action and on-chain metrics signal bullish momentum

Shiba Inu is poised for a rally as price action and on-chain metrics signal bullish momentum

Shiba Inu remains strong on Friday after breaking above a symmetrical triangle pattern on Thursday. This breakout signals bullish momentum, further bolstered by a rise in daily new transactions that suggests a potential rally in the coming days.

More Shiba Inu News
Bitcoin: On the road to $60,000

Bitcoin: On the road to $60,000

Bitcoin price retested and bounced off from the daily support level of $56,000 this week. US spot Bitcoin ETFs posted $140.7 million in inflows until Thursday and on-chain data supports a bullish outlook.

Read full analysis
Moneta Markets review 2024: All you need to know

Moneta Markets review 2024: All you need to know

VERIFIED In this review, the FXStreet team provides an independent and thorough analysis based on direct testing and real experiences with Moneta Markets – an excellent broker for novice to intermediate forex traders who want to broaden their knowledge base.

Read More

BTC

ETH

XRP