Polkadot Price Forecast: DOT extended, may correct before resuming uptrend
- Polkadot price has climbed 87% over the last 21 sessions, lifting the August return to 21.48%.
- DOT claimed the strategically important 50-week simple moving average (SMA), currently at $18.40.
- Daily Relative Strength Index (RSI) reached an overbought reading for the first time since the early-April high.

Polkadot price has delivered solid gains for investors, marching 87% while recording three consecutive positive weeks and a 21.48% gain for August. The impulsive rally has struck stiff resistance at a price range of $18.39 to $20.80, formed by lows printed in late May and in the first half of June. The overbought condition, stiff resistance and potential for a head-and-shoulders top on the daily RSI suggests some caution at the current DOT price levels.
Polkadot price confirms the rise of altcoins again
Polkadot price has engineered an impressive rally, and it has been supported by a surge in volume, with several days closing well above the 50-day average. The DOT rebound has also been reinforced by intra-day milestones, including a bullish Golden Cross pattern on the six-hour chart.
The momentum generated by the Polkadot price rally activated a bullish Golden Cross pattern on the six-hour chart on August 4, when the 50 six-hour SMA crossed above the 200 six-hour SMA. The last Golden Cross that accompanied a major DOT bottom was the beginning of November 2020, before the steep rally of over 40% later in the month.
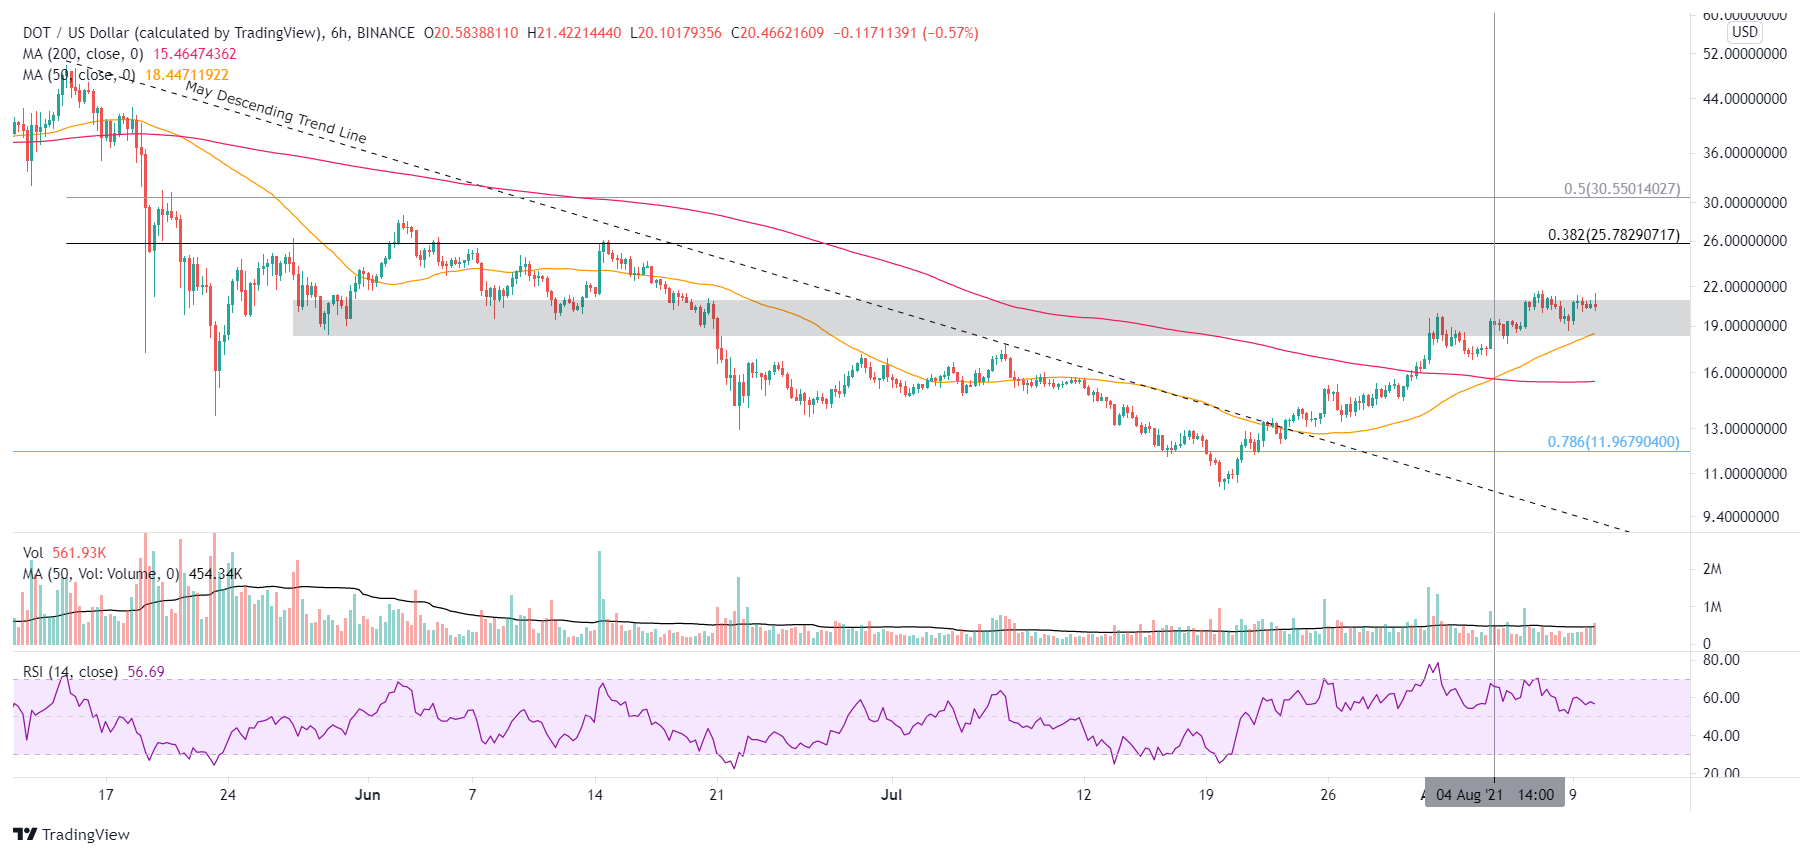
DOT/USD 6-hour chart
The explosive Polkadot price rally has reached a concerning deviation from the 50-day SMA in the short term. The 31% deviation indicates that DOT may be primed to retrace some of the recent gains to release price congestion. However, the correction could also occur over time and not price.
A second reason for some form of corrective process is the limited Polkadot price progress after it rallied into the price range of $18.39 to $20.80 on August 1. DOT has only managed to gain another 7% from the August 1 high of $20.50 to the August 7 high of $21.95. Moreover, the altcoin has closed five of the previous six sessions inside the range and is set to do so again today.
Ideally, the downside should be limited to the low of the range at $18.39 or the July 7 high of $17.88. Additional DOT weakness will not find support until the 50-day SMA at $15.55, leaving Polkadot price to confront the resistance associated with the price range again.
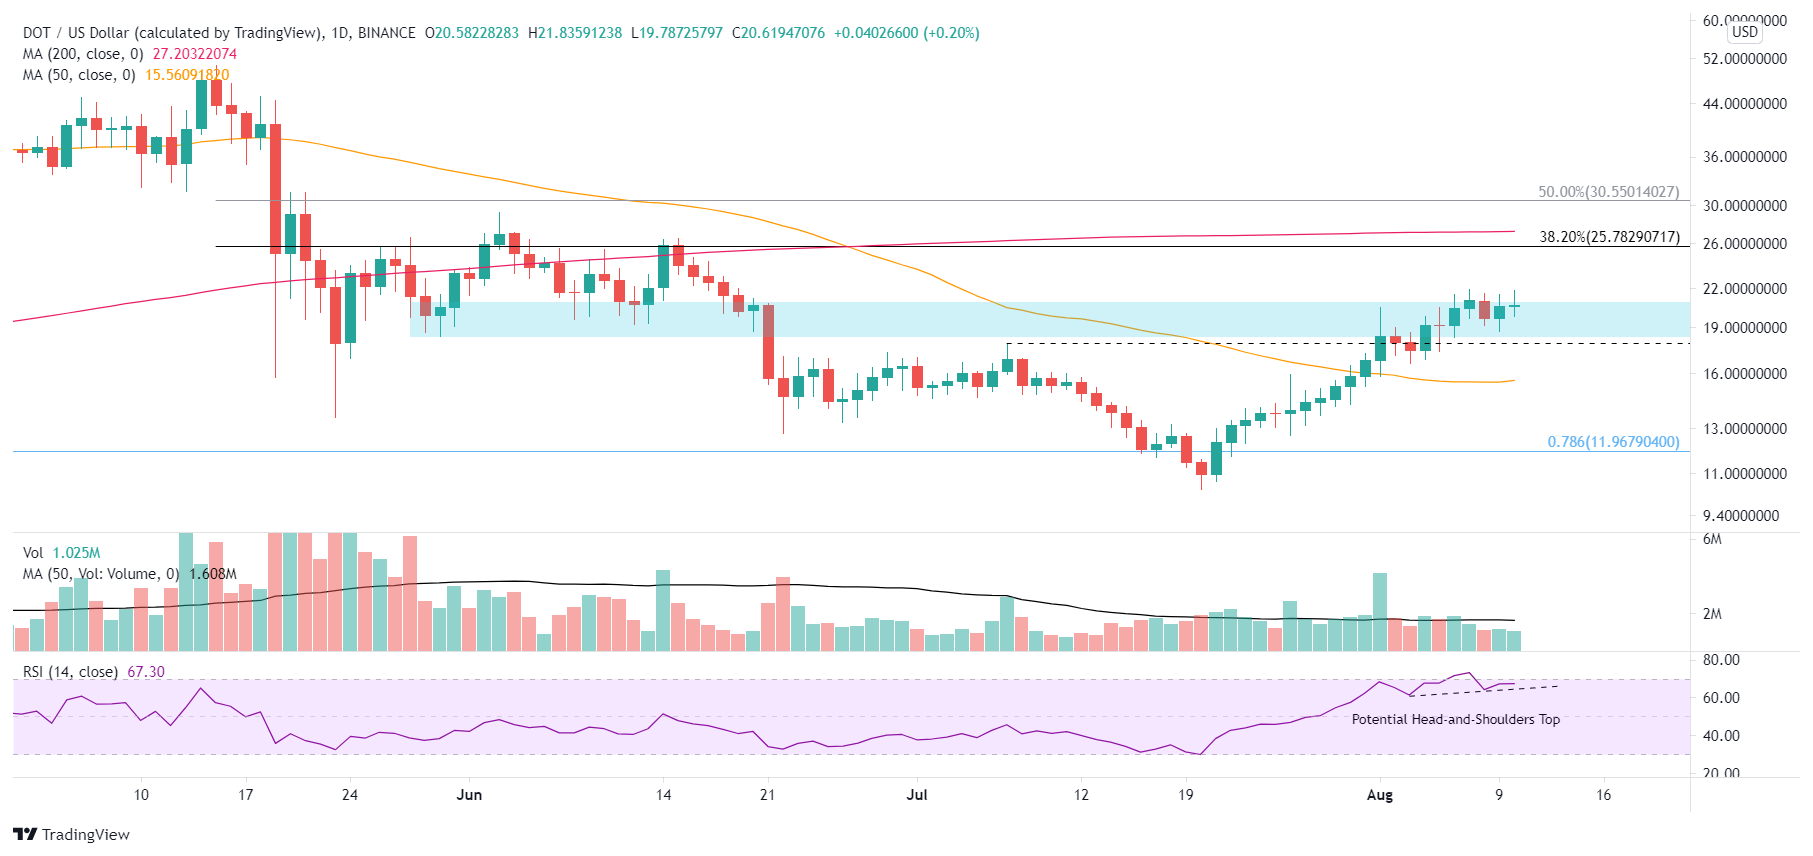
DOT/USD daily chart
Suppose the DOT consolidation over the last eight days is the limit of the correction. In that case, it should not discover resistance until the 38.2% Fibonacci retracement of the entire correction at $25.78 and then the 200-day SMA at $27.20, representing a 32% gain from the current Polkadot price.
The catalysts are in place for a DOT correction, an overbought reading on the daily RSI, a credible resistance price range, and a notable deviation from the 50-day SMA. Nevertheless, the 87% gain over the last 21 sessions is one of the confirmations that altcoins have re-established a presence in the cryptocurrency complex, and Polkadot price should still tag higher prices in the weeks ahead.
Author

Sheldon McIntyre, CMT
Independent Analyst
Sheldon has 24 years of investment experience holding various positions in companies based in the United States and Chile. His core competencies include BRIC and G-10 equity markets, swing and position trading and technical analysis.


