Polkadot price stuck in bearish pennant, looking for a break lower towards $31.61
- Polkadot price is still under pressure as the downtrend enters its next cycle.
- DOT price looks to be breaking down out of a pennant towards $37.03.
- With the breakout, bears will penetrate $37.03 and open up more space to fall towards $31.61.

Polkadot (DOT) price is showing no signs yet of the downtrend being over anytime soon as bears build momentum for another bearish break of $37.03. DOT price has seen bulls backing off as the Relative Strength Index (RSI) dipped further towards the oversold region but gave no signs of a bullish counteractive move in sight. Expect bears to penetrate $37.03 and decline another 15% towards $31.61.
Polkadot price correction could hold another 15% of depreciation
Polkadot price has not had a good November thus far after hitting a new all-time high at $55 at the end of October and then losing around 20%. A bearish pennant price pattern is showing signs of breaking below $37.03 and starting another downleg. The 55-day Simple Moving Average, overhead, has added additional weight capping the downtrend.
DOT price will pierce below $37.03, and accelerate lower, fuelled by bulls cover¡ing to minimize losses. With no real technical support in the way, DOT price could see an accelerated move down towards $31.61, holding another 15% price correction for Polkadot. This would amount to a 35% total retracement of the uptrend that started this summer and ended when Polkadot price peaked in October.
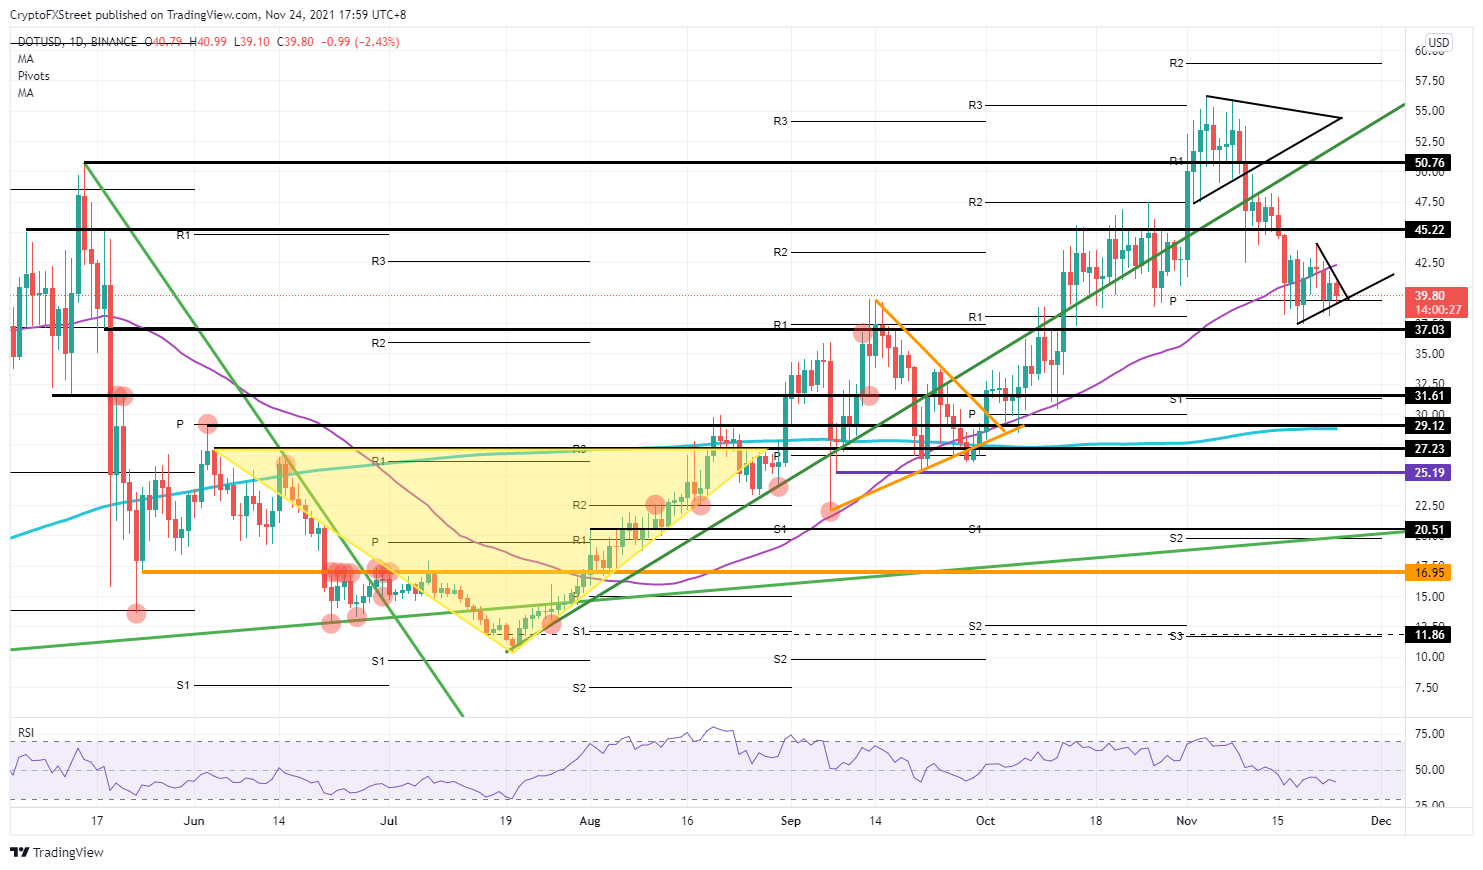
DOT/USD daily chart
But that is as far as the correction should go, as bulls will be appealing to get in and defend DOT price with a wide range of support elements in just a 5$ price range. Around $31.61, there is not only the historical level but also the S1 monthly support level coming in. A few ticks below, there are at least three other historical support levels and the 200-day SMA, which makes this zone a perfect area for a fade-in trade for bulls before the price will be launched back up towards $37.03 and $45.22 once the global correction in cryptocurrencies has faded.
Author

Filip Lagaart
FXStreet
Filip Lagaart is a former sales/trader with over 15 years of financial markets expertise under its belt.


