Polkadot price presents buy opportunity before DOT triggers 65% breakout
- Polkadot price is currently consolidating inside the $40.06 to $48.34 supply zone.
- DOT might dip to the $37.50 support floor from where it may catalyze a 65% bull run.
- A decisive close below $33.27 will invalidate the bullish thesis.

Polkadot price is facing enormous resistance as it sits inside a supply zone. Clearing this barrier will open the path for DOT to retest its all-time high and set a new one.
Polkadot price prepares for massive move
Polkadot price has risen 321% since its bottom on July 21 at $10.37. DOT is currently trading inside a supply zone, ranging from $40.06 to $48.34. This barrier has prevented Polkadot price from moving higher over the past eleven days and shows the same will continue going forward.
Investors can expect Polkadot price to retrace to the $38.76 support level before moving to the said supply zone. In some cases, DOT might briefly dip into the demand area, ranging from $33.27 to $37.50.
Either way, these retracements provide market participants with an opportunity to accumulate DOT for the incoming yet explosive move higher. If Polkadot price produces a decisive close above $48.34, it will indicate the start of an uptrend. In this case, DOT will head to retest the 100% trend-based Fibonacci retracement level at $53.88 or a new all-time high.
This move will likely extend further to the next level at $71.43, where Polkadot price will make another record high after a 65% ascent.
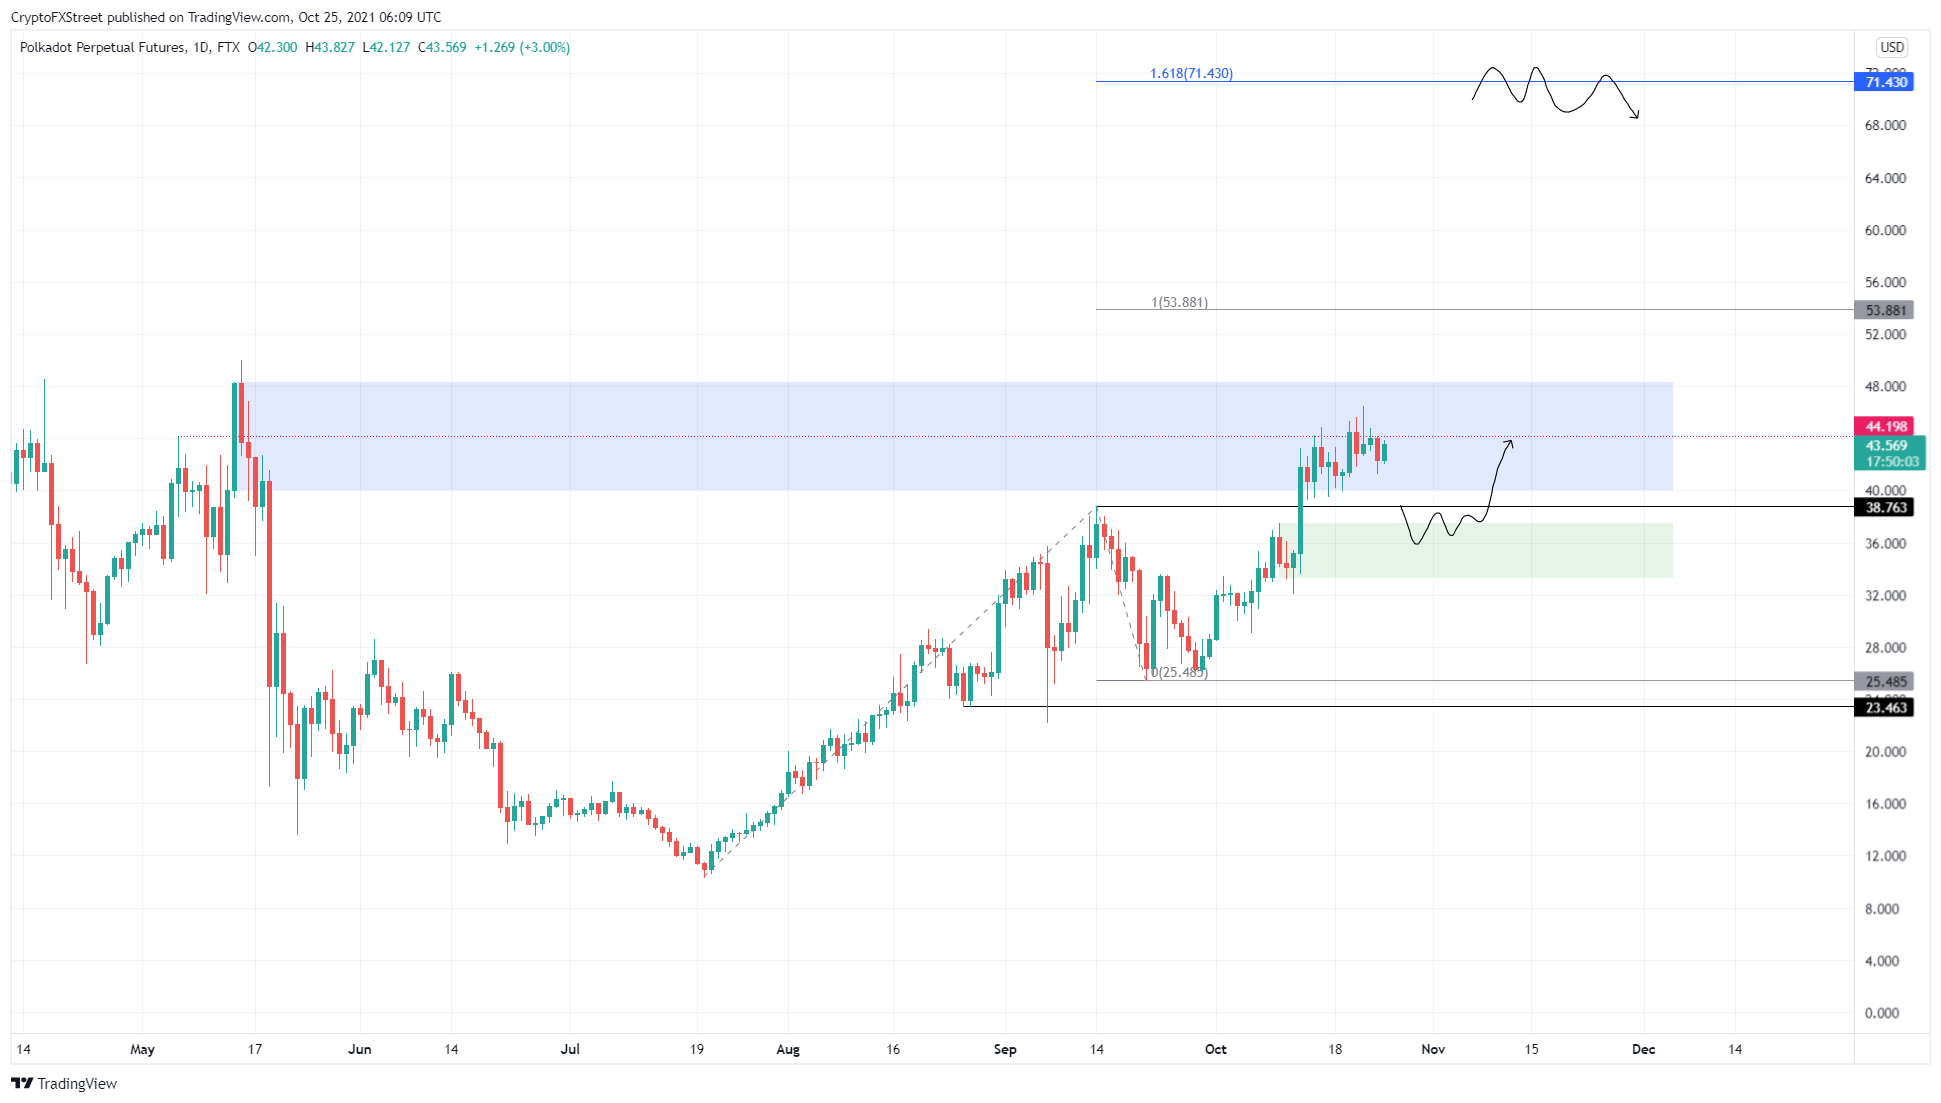
DOT/USDT 1-day chart
Regardless of the bullishness surrounding Polkadot price, a breakdown of $33.27 will indicate a weakness among buyers. This move will also invalidate the bullish thesis.
Under these circumstances, Polkadot price might revisit the $25.49 foothold.
Author

Akash Girimath
FXStreet
Akash Girimath is a Mechanical Engineer interested in the chaos of the financial markets. Trying to make sense of this convoluted yet fascinating space, he switched his engineering job to become a crypto reporter and analyst.


