Polkadot price sees bullish breakout, but risks fading
- Polkadot price has attempted to break above $45.22 for the fourth time.
- DOT price will see more bulls coming in and target $50.76 to the upside
- As external tailwinds have not fully impacted DOT price, expect the positive effect to happen soon.

Polkadot (DOT) has made another attempt to break out of the bullish triangle. This is the fourth time already in just one month that price has tried to break to the upside, making it primed to likely succeed at the next attempt. Bulls will want to sit on their long positions before cashing in at $50.76.
DOT price sees bulls not taking any profit until $50.76
Polkadot price should have broken to the upside already by now, as the bullish triangle favored an extension of the uptrend. Despite the favorable tailwinds currently in cryptocurrencies, DOT has failed to capitalize. Instead, bulls are taking more and more profit around $45.22, the base of the triangle, and the buy-volume needed for any further uptrend is fading.
The risk is now that, should any of the favorable tailwinds start to fade, – if, for example, Bitcoin were unable to make new all-time highs – a downward move could start to accelerate as bears quickly take the upper hand. At first, the green ascending trend line would be broken to the downside with a first halt at $38. That level falls in line with the monthly R1 and has proven its resistance in the past few days.
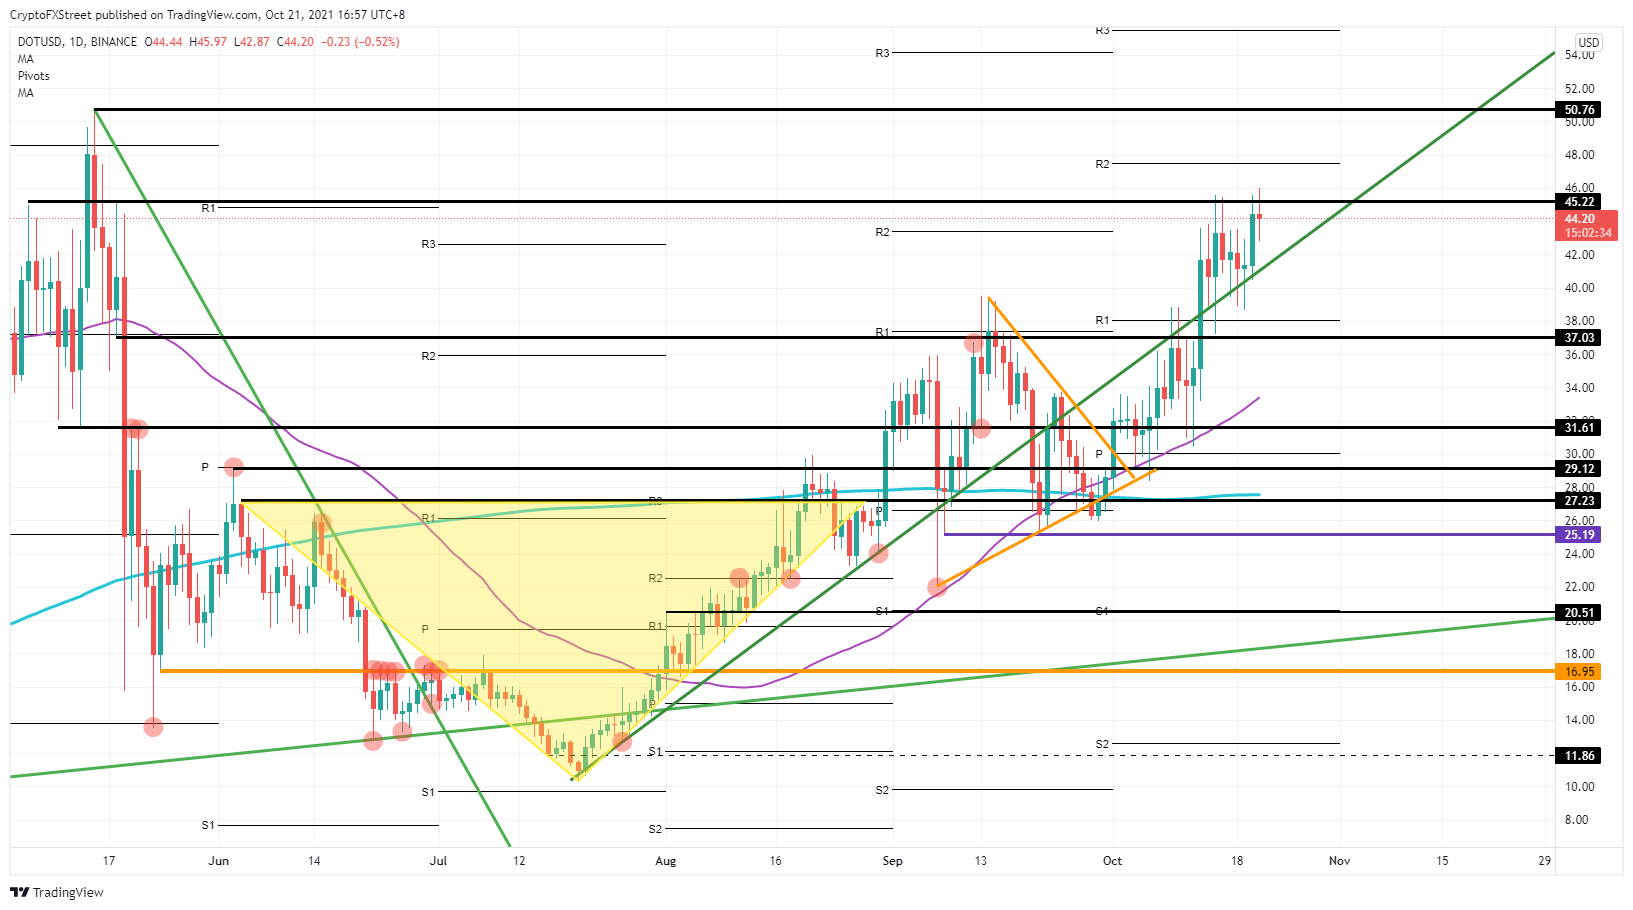
DOT/USD daily chart
DOT price has not yet enjoyed to the full, the positive tailwinds and spillover effects from Bitcoin, suggesting there may still be more room to go, and Polkadot price could be ready to break above $45.22. Expect bulls to quickly face some resistance around the monthly R2 at $47.44. Once through that, however, it should be plain sailing towards $50.76.
In case those tailwinds start to fade, expect a break below the green ascending trend line towards $37.03. From there bears will want to target $27.23, which will act as pivot to decide if either the uptrend still has a possibility for recovery, or if a new downtrend will start.
Author

Filip Lagaart
FXStreet
Filip Lagaart is a former sales/trader with over 15 years of financial markets expertise under its belt.


