Polkadot Price Prediction: DOT indecisive, exposed to a 20% decline
- Polkadot price struggling to overcome resistance at the 200-day simple moving average (SMA).
- February 23 and April 23 lows create a significant technical challenge.
- Lack of support leaves DOT vulnerable to a new wave of liquidation in the cryptocurrency market.

Polkadot price has not identified any price traction above $25.90 since the rebound from the May 23 low. The range of resistance defined by the 200-day SMA at $23.57 and $25.90 may continue to stifle DOT bounces in the short term, encouraging investors to study opportunities from a long and short perspective.
Polkadot price has yet to show healthy accumulation
Polkadot price will close May with a 36% loss after falling over 70% from the May 15 high at $50.74 to the May 23 low at $13.59. The volatility included a 60% collapse on May 19 before rebounding later in the day. The low of the correction undercut the 78.6% Fibonacci retracement of the 2021 rally at $14.89.
DOT did rebound close to 100% from the May 23 low to the May 28 high at $26.66 before falling below the 200-day SMA again. The strategically important moving average has played a role in Polkadot price for most of the days since May 23, establishing it as an essential determinant for the long-term direction of the digital asset.
Polkadot price strength will likely be contained to the 200-day SMA until a credible base can be identified on a relevant timeframe. Based on the speed of the decline, DOT is combating elevated levels of price compression that need to be released before it can attract more committed investors.
If Polkadot price does overcome the moving average at $23.57, it will quickly hit superior resistance at $25.90, a level just above the April 23 low at $25.82 and the February 23 low at $25.87. From May 26-28, DOT reversed near the price level, fortifying its importance in the narrative.
A daily close above $25.90 would encourage investors to consider higher resistance levels, beginning with the 38.2% Fibonacci retracement at $27.78 and then the 50% retracement at $32.16. Ambitious investors will strike resistance at the declining 50-day SMA at $34.05.
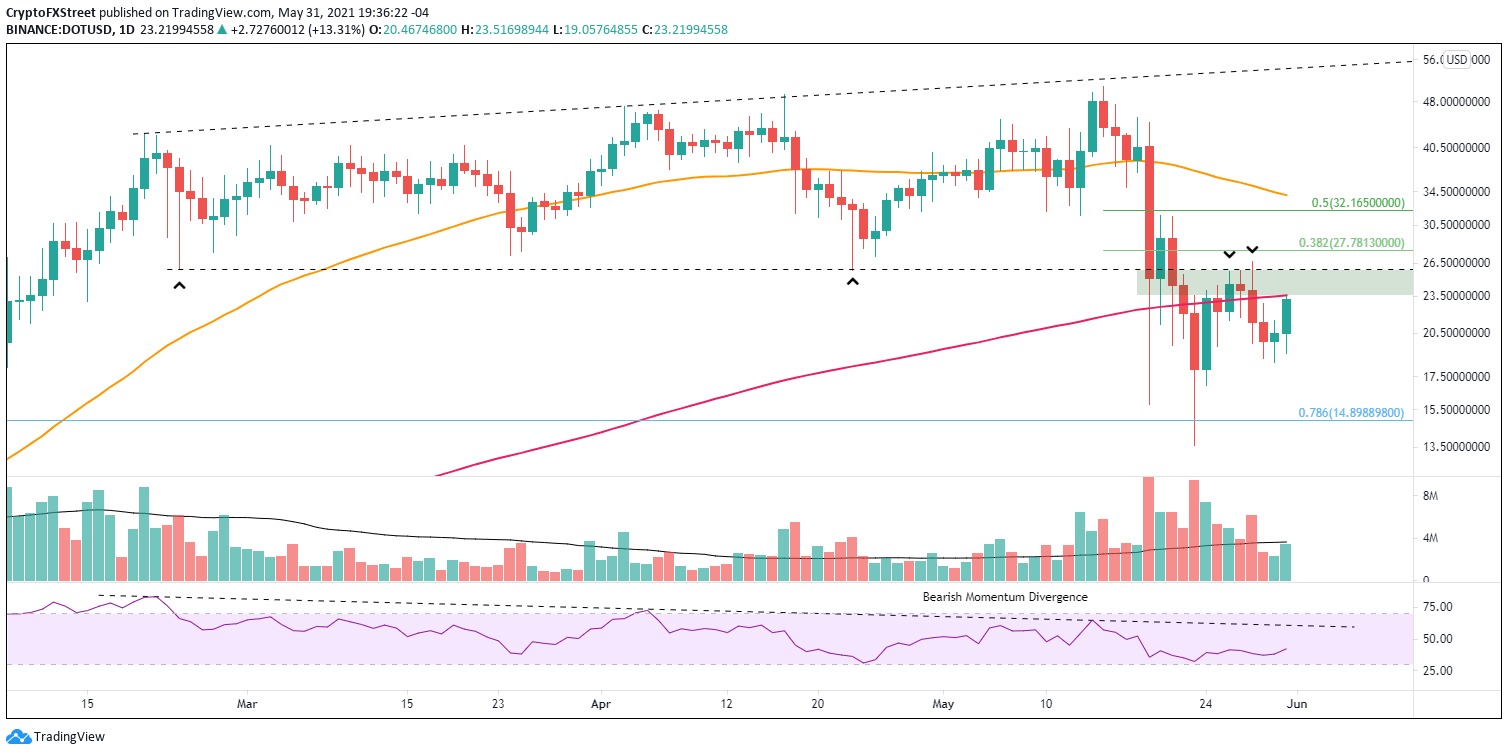
DOT/USD daily chart
Since Polkadot price is trading below a critical moving average, it is advisable to consider the downside. DOT has few notable support levels, except for the May 30 low at $18.39, representing a 20% decline, and then the May 24 low at $16.94. Any weakness beyond those prices confirms the cryptocurrency still has not recorded a definitive correction low.
With the upside resistance clearly defined and only minor support, there is a high probability that Polkadot price is exposed to further losses.
Author

Sheldon McIntyre, CMT
Independent Analyst
Sheldon has 24 years of investment experience holding various positions in companies based in the United States and Chile. His core competencies include BRIC and G-10 equity markets, swing and position trading and technical analysis.


