Polkadot Price Forecast: DOT primed to rally 30% after collecting liquidity
- Polkadot price looks ready for a bounce as it dips into a demand zone, stretching from $18.46 to $21.73.
- The MRI’s buy signal adds credence to the bullish hypothesis.
- A potential spike in buying pressure could propel DOT up by 30% to $28.96.

Polkadot price suffered a fatal drop like most altcoins during the market crash on May 19 and 23. However, unlike most cryptocurrencies, DOT seems to have spawned a confluence of buy signals that suggest a bullish phase will arrive shortly.
Polkadot price strengthens its upswing narrative
Polkadot price is currently trading at $22.41, just above the demand zone scales from $18.46 to $21.73. The recent dip into this area is likely to have provided DOT with buying pressure from sidelined investors. Therefore, Polkadot price is preparing for a move higher.
Adding a tailwind to this directional move is the Momentum Reversal Indicator (MRI), which flashed a buy signal in the form of a green ‘one’ candlestick on the daily chart.
This setup forecasts a one-to-four candlestick uptick in Polkdaot price. Therefore, a decisive daily candlestick close above the 200-day Simple Moving Average (SMA) at $23.03 will confirm this optimistic scenario.
In such a case, the DeFi coin could rally 15% to tag the immediate resistance level at $26.50. Following a breach of this level, $28.96 will be tested, roughly 30% from the current position at $22.41.
Furthermore, if DOT manages to rise above $32.20, the SuperTrend indicator would trigger a buy signal, indicating a shift in trend from bearish to bullish.
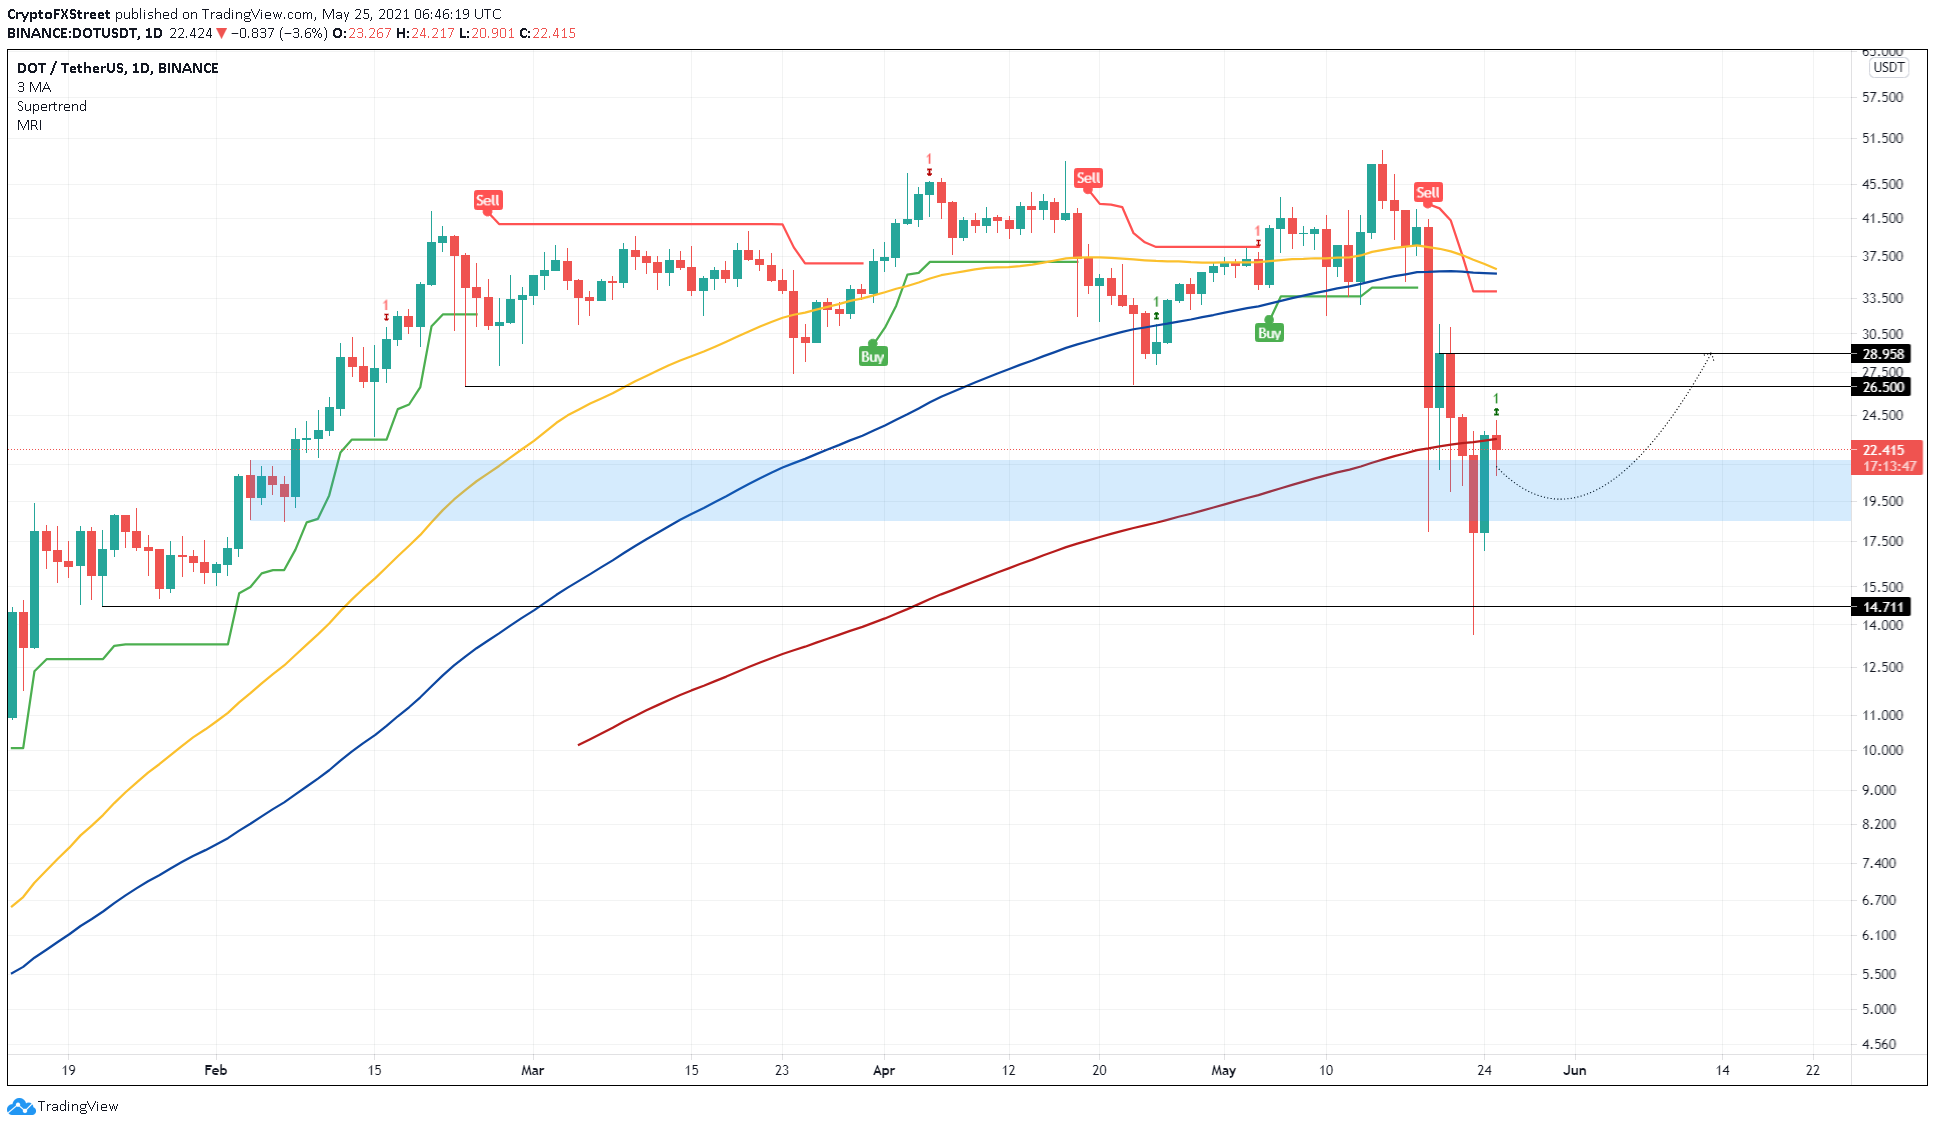
DOT/USDT 1-day chart
On the flip side, if the correction into the demand zone, ranging from $18.46 to $21.73, extends below the lower limit and generates a daily close below it, the bullish narrative explained above will face invalidation.
These developments might further push Polkadot price nearly 20% to retest $14.71.
Author

Akash Girimath
FXStreet
Akash Girimath is a Mechanical Engineer interested in the chaos of the financial markets. Trying to make sense of this convoluted yet fascinating space, he switched his engineering job to become a crypto reporter and analyst.



